


0
US Dollar Index
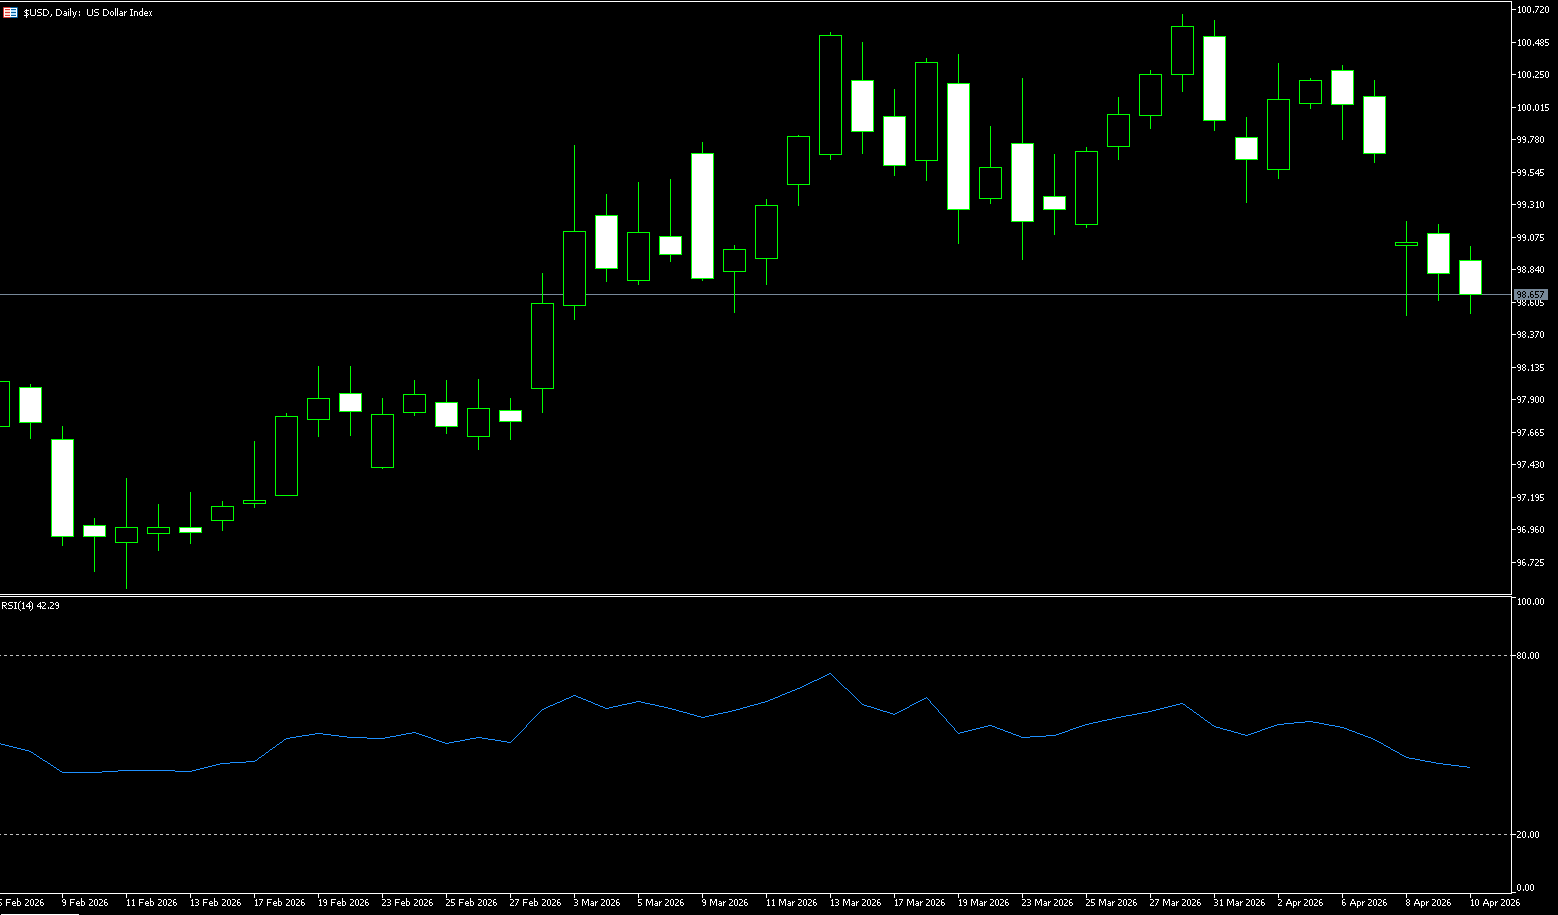
The recent safe-haven rally in the US dollar has reversed as signs of de-escalation in the Middle East geopolitical situation have emerged. US President Trump officially announced a two-week postponement of the planned strikes on Iranian civilian infrastructure, defining the move as a "two-way ceasefire linked to the reopening of the Strait of Hormuz." This statement directly dispelled market concerns about escalating conflict. Against the backdrop of upcoming permanent ceasefire talks between the US and Iran in Islamabad, Pakistan on Saturday, the US dollar index fell 1.6% for the week, marking its largest weekly drop since January. In March, the dollar had risen strongly as one of the few safe-haven assets, as the situation in Iran led to soaring oil prices, setbacks in stocks and gold, and inflationary concerns pressured the bond market. In recent weeks, defensive positions supporting the dollar's strength have begun to loosen, pushing the dollar index down significantly. This dollar correction is a reasonable adjustment in logic—the previous dollar rally was mainly driven by three factors: safe-haven sentiment due to escalating Middle East conflict, supply concerns due to disruptions in oil transport through the Strait of Hormuz, and market expectations that the Federal Reserve would maintain high interest rates for a longer period. With the immediate risk of conflict temporarily postponed, the associated risk premium is naturally receding. The US dollar is currently in a "two-way tug-of-war": on the one hand, the safe-haven demand following the Iranian ceasefire has subsided, weakening the core driver of the dollar's previous rise; on the other hand, high inflation expectations are sufficient to prevent a full-blown dovish market, providing support for the dollar. Looking ahead, the direction of the dollar index will depend primarily on two key conditions: first, whether the ceasefire agreement can remain in effect and whether geopolitical conflicts in the Middle East will escalate again; second, whether subsequent US inflation data (especially the upcoming CPI data) will show a downward trend.
Last week, the dollar index showed a pattern of rising and then falling, weakening after a period of fluctuation. On April 8th, it plummeted to 98.29 (a four-week low) due to news of the US-Iran ceasefire, and is currently testing the key support level of 98.52 (the 200-day simple moving average). The technical outlook has shifted from neutral-to-bullish to neutral-to-bearish. A decisive break below the 200-day simple moving average would open up further downside potential, with resistance concentrated at the 99.65 (20-day simple moving average) and 100.00 (psychological level) areas. Previously, the dollar's rise was primarily driven by three factors: risk aversion due to escalating Middle East conflict, supply concerns due to disruptions in oil transport through the Strait of Hormuz, and market expectations that the Federal Reserve would maintain high interest rates for an extended period. Now that the immediate conflict risk has been temporarily postponed, this overlapping risk premium is naturally diminishing. The short-term moving averages (5-day/10-day) have formed a bearish alignment, with the 5-day moving average crossing below the 10-day moving average, putting downward pressure on the dollar index. The medium-term moving average (20-day) is located around 99.65, becoming a significant resistance level. Regarding the technical indicator RSI (14): it has fallen from 52 last week to below 45.69, entering a neutral-to-bearish range, indicating a waning upward momentum; the MACD has formed a death cross, with the histogram entering negative territory and starting to increase in volume, clearly indicating a bearish signal. Currently, the US dollar index has a potential double-top pattern: a double top formed in the 100.64 area, confirmed by the sharp drop on April 8th; due to breaking below the 20-day moving average bullish trendline support at 99.65, it has now become strong resistance and the first resistance level; then comes 100 (a psychological level), and the double-top pattern formed in the 100.64 area. If the ceasefire continues and inflation cools, the US dollar index may further decline, with the first target at 98.51 (the 200-day moving average); then towards the 98.00 (a psychological level).
Today, consider shorting the US Dollar Index at 98.80, with a stop-loss at 98.90 and targets at 98.40 and 98.30.
WTI Crude Oil
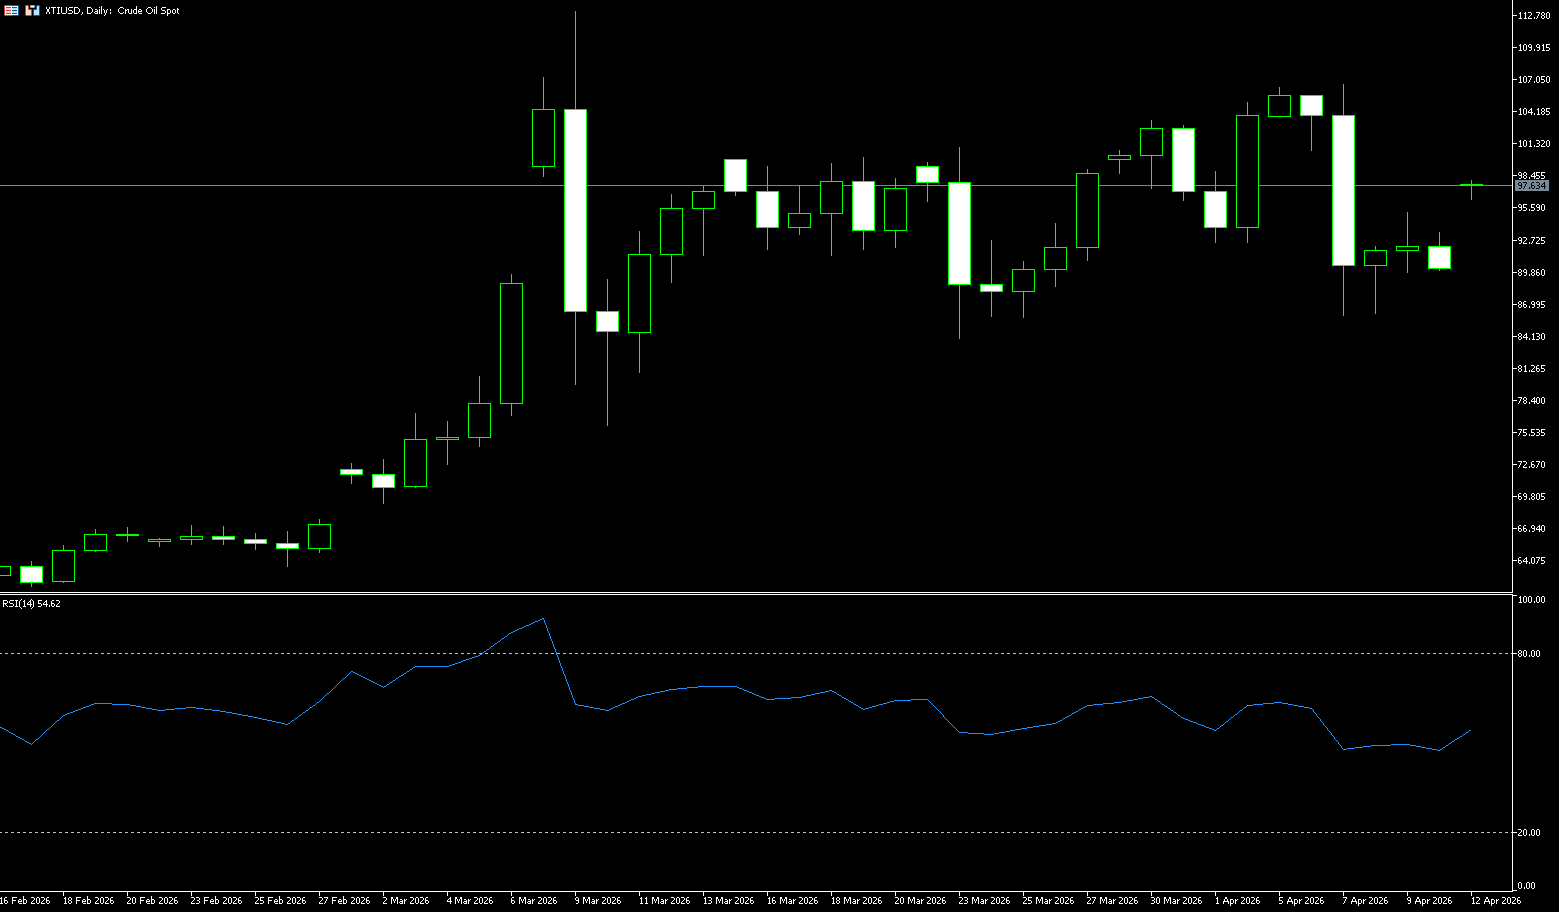
WTI oil prices plummeted last week due to the two-week interim agreement between the US and Iran, with prices falling by over 15% at one point. The price drop was based on the expectation that the Strait of Hormuz would reopen, allowing pent-up energy supplies to be transported through the waterway. However, the market sentiment behind the plunge was not simply optimistic. The delivery timeline from loading to unloading means that immediate supply may remain constrained in the coming weeks, with over 800 ships still stranded in the Persian Gulf, requiring robust security guarantees before departure. Therefore, this plunge was more of a short-term panic sell-off driven by news than a substantial reversal in supply and demand fundamentals. Oil prices initially plunged to nearly $86 per barrel on Wednesday after the US and Iran reached a temporary agreement. However, during US trading hours, Israel launched its largest airstrike against Hezbollah in Lebanon since the start of the conflict. Iran immediately accused the action of violating the ceasefire agreement and re-closed the Strait of Hormuz, causing oil prices to rebound. In the context of these events, the conflict in the Middle East continues, and the situation has not seen any substantial easing despite the ceasefire proposal. Israel's military operation in Lebanon is ongoing, and significant disagreements exist between Iran and other parties regarding the scope of the ceasefire, causing market expectations for regional stability to fluctuate repeatedly. Meanwhile, Iran pointed out that several clauses in the ceasefire proposal had been violated, further weakening market confidence in a de-escalation. The core driving logic for international oil prices has shifted from short-term event shocks to medium- to long-term supply constraints. Although ceasefire expectations initially suppressed risk premiums, the severe damage to energy infrastructure in the Middle East makes supply recovery highly uncertain. Against this backdrop, a shift towards a higher central oil price has become a market consensus.
Last week, WTI crude oil exhibited a pattern of "high-level breakdown and sharp drop – oversold rebound – high-level consolidation," with the medium-term trend dominated by bears and short-term volatility driven by geopolitical news. The daily chart shows that WTI crude oil prices rebounded after a rapid decline, but overall remain within a high-level consolidation range, exhibiting a trend of rising central pivot points. The current level around $90 forms key support; this position is both a previous pullback low and a key level separating bulls and bears. A break below this level could trigger further downside. On the upside, there is resistance at the $100 psychological and technical level. Regarding the moving average system, crude oil prices have broken below all short-term moving averages (5/10/20-day moving averages), which are in a bearish alignment. The 14-day RSI has rapidly fallen from overbought territory (>70) to the 45-50 range, indicating bears are in control but nearing oversold territory, suggesting a potential rebound. The MACD shows a downward death cross with expanding green bars, indicating strong bearish momentum, but no trend reversal signal has yet formed. Short-term prices are trading within a rebound channel, but upward momentum is gradually weakening. Repeated attempts to break through $100 without success could trigger a technical pullback; conversely, a break above this level could open up new upside potential. Overall, oil prices are expected to remain range-bound in the short term, awaiting further fundamental guidance. Recurring tensions in the Middle East (such as changes to the ceasefire agreement or renewed closure of the Straits of Hormuz) could trigger a V-shaped reversal, requiring strict risk management. Rebounds are corrections, and selling on rallies is the prevailing strategy. Therefore, on the upside, consider $95.56 (the 20-day moving average), with a break above that targeting $99.39 (last week's high) and the $100.00 (psychological level). On the downside, key support is at $86.00 (last week's sharp drop low), with a break below that targeting $84.16 (the 40-day moving average).
Today, consider going long on crude oil at 90.18, with a stop loss at 90.00 and targets at 92.00 and 93.00.
Spot Gold
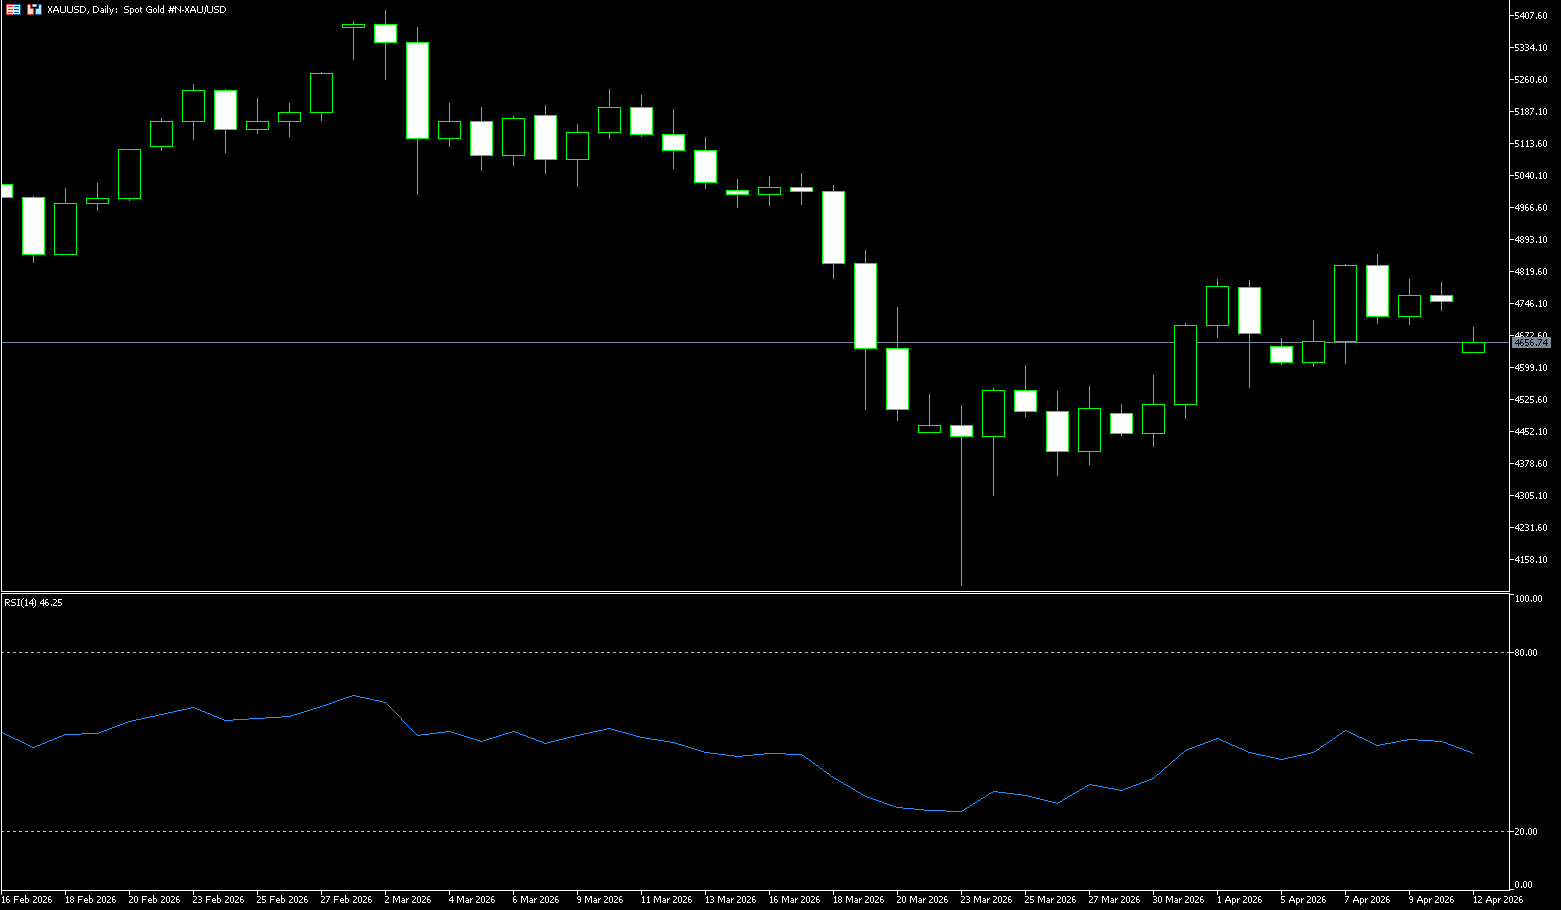
Following the two-week ceasefire agreement reached between the US and Iran last week, spot gold surged by over 3%, reaching a high of $4,856.90 per ounce. The ceasefire news pushed oil prices below $100 per barrel, the dollar index declined, significantly easing inflation concerns and reigniting expectations of a Fed rate cut, providing short-term support for gold. However, on the first day of the ceasefire, Israel launched a large-scale airstrike on Lebanon, and Iran re-blocked the Strait of Hormuz, leading to renewed tensions. Gold prices gave back significantly before the weekend, falling to around $4,700. Analysts believe the current rebound is more of a "relief rally," and negotiations still face multiple obstacles; whether the Strait of Hormuz reopens will be crucial. The core logic behind this surge in gold prices is not complex. The ceasefire agreement directly pushed oil prices below the $100 per barrel mark, while the dollar also fell to its lowest level in a month against a basket of major currencies. For gold, a weaker dollar means that dollar-denominated gold becomes cheaper for investors holding other currencies, which in itself stimulates buying demand. More importantly, the plunge in oil prices significantly alleviated market concerns about continued worsening inflation, a major factor suppressing gold's performance in previous weeks. From a broader perspective, the current situation in the Middle East actually creates a relatively favorable environment for gold. This is not because of the ceasefire itself, but precisely because the ceasefire is too fragile and the prospects for peace are too bleak. This highly uncertain geopolitical environment is precisely the best fertile ground for gold to function as a safe-haven asset.
Last week, the gold market witnessed a stunning performance. After news broke that the US and Iran had agreed to a two-week truce, spot gold prices surged by more than 3%, reaching a strong high of $4,856.93 per ounce, a nearly three-week high since March 19. From a market sentiment perspective, investors are currently clearly divided. Some believe the ceasefire will continue, thus weakening the upward momentum of gold; others believe the situation still carries the risk of recurrence and tend to continue allocating gold as a hedging tool. This divergence directly leads to increased volatility in gold prices, but overall they remain within a high range. From a technical perspective, the daily chart shows that gold has shown signs of a pullback after high-level consolidation. Short-term moving averages are in a bearish alignment, putting pressure on any rebound, but the medium- and long-term trend remains intact, and the overall market remains within a bullish framework. The RSI (14-day) has fallen from the overbought zone to the neutral zone of 49.46, indicating a weakening of bearish momentum and no clear oversold signal, suggesting the correction is not yet complete. As for the volume structure, the high-level trading volume indicates increased divergence between bulls and bears, showing a coexistence of profit-taking and bargain hunting. However, the overall upward trend has not been broken, and the structure remains dominated by bulls. Currently, the key short-term support levels are around $4,680.70 (the 100-day moving average) and $4,662 (the low of April 1st). A break below these levels could trigger further pullbacks to the $4,570 and $4,500 (psychological level) areas. On the upside, watch for resistance around $4,857 (last week's high), a previous high with significant selling pressure. A break below this level would challenge the $4,680.70 (100-day moving average) and $4,662 (April 1st low) areas. At this stage, if gold prices cannot quickly recover above $4,750-$4,800, a short-term correction to the $4,600 (psychological level) and $4,519 (the 134-day moving average) levels is possible. However, if prices regain a foothold, a retest of the previous high of $4,800-$4,857 is possible. Overall, gold is expected to fluctuate in the short term, but maintain a bullish structure in the medium term, targeting the psychological level of $5,000.
Today, consider going long on spot gold at 4,743, with a stop-loss at 4,738 and targets at 4,780 and 4,800.
AUD/USD
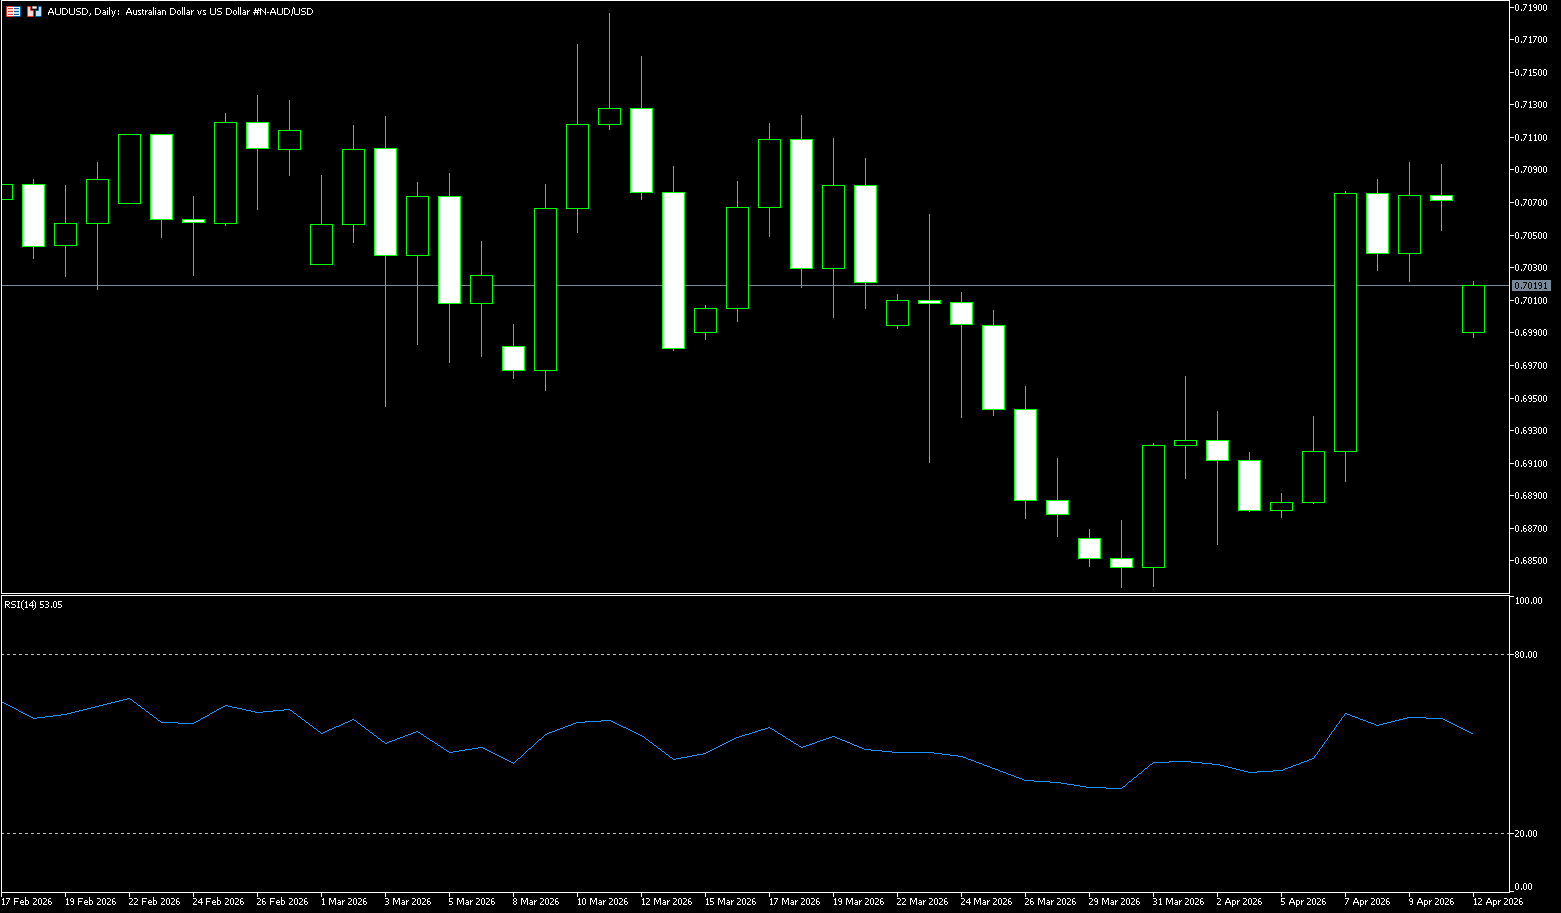
The Australian dollar remained above $0.7000 last week, holding near a three-week high and poised for its strongest weekly gain since mid-January, rising more than 2.5% this week. A two-week ceasefire in the Middle East boosted global risk sentiment and put pressure on the US dollar. Markets are now focused on upcoming diplomatic talks, with US Vice President Vance leading discussions in Islamabad this weekend. However, despite signs of potential direct negotiations, ongoing Israeli attacks on Lebanon continue, causing persistent uncertainty, while disruptions in the Strait of Hormuz increase concerns about global energy flows. President Trump has also warned of potential escalation if the ceasefire is not observed, including concerns about imposing fees on ships transiting the Strait of Hormuz. In Australia, the Reserve Bank has raised interest rates twice this year to 4.10%, while inflation remains above its target range. Meanwhile, with the fragile two-week ceasefire largely intact, senior officials plan to meet in Pakistan this weekend to discuss a potential long-term agreement with Iran. At the same time, Iranian Foreign Ministry spokesman Esmail Bagheei stated that negotiations depend on the US adhering to its ceasefire commitments, including ceasing hostilities in Lebanon, but Washington and Israel have denied this interpretation. The outlook for the AUD/USD pair is highly dependent on geopolitical developments. While the Reserve Bank of Australia's hawkish stance provides fundamental support, the pair's movement will largely depend on global risk sentiment, oil price dynamics, and the evolution of the situation in Iran.
The core technical analysis of the AUD/USD pair last week showed that the medium-term bullish trend remains intact, but it encountered resistance at a key resistance level in the short term, entering a period of high-level consolidation. Last week was likely to remain range-bound, with attention focused on the breakout direction. After a series of consecutive weekly gains, last week saw a pullback from the highs, forming a high-level inside bar/consolidation pattern, suggesting a possible slowdown in bullish momentum. The medium-term bullish trend in AUD/USD remains intact. This week, it's highly likely to consolidate within the 0.6876 (last week's low) – 0.7187 (March 11 high) range, digesting previous profit-taking. The pair is trading above the 55/100/200-day simple moving averages, which are in a bullish alignment, clearly indicating a bullish medium-term trend. The 25-day moving average (around 0.6999) and the 0.7000 (psychological level) are key short-term support areas. The RSI (14-day) is around 57-60, in bullish territory but far from overbought, indicating moderate and undiminished upward momentum. The MACD remains in a golden cross and positive, but the histogram is contracting, suggesting a slowdown in short-term gains.
Currently, the pair holds a short-term bullish bias, reinforcing fundamental demand. Momentum is constructive, indicating a positive but not overly strong uptrend. As long as the spot price remains above its key moving averages, there is still room for further gains. Below, initial support is near the psychological level of 0.7000, followed by the 23.6% Fibonacci retracement level at 0.7007, forming the first demand zone. Below this area, broader support is clustered at 0.6943 (75-day moving average), while a deeper pullback will target the psychological level of 0.6900. Immediate resistance is at 0.7138 (daily Bollinger Band upper trendline), followed by resistance at 0.7187 (March 11 high) and further away at the 0.7200 level.
Consider going long on AUD at 0.7052 today, with a stop loss at 0.7040 and targets at 0.7100 and 0.7090.
GBP/USD
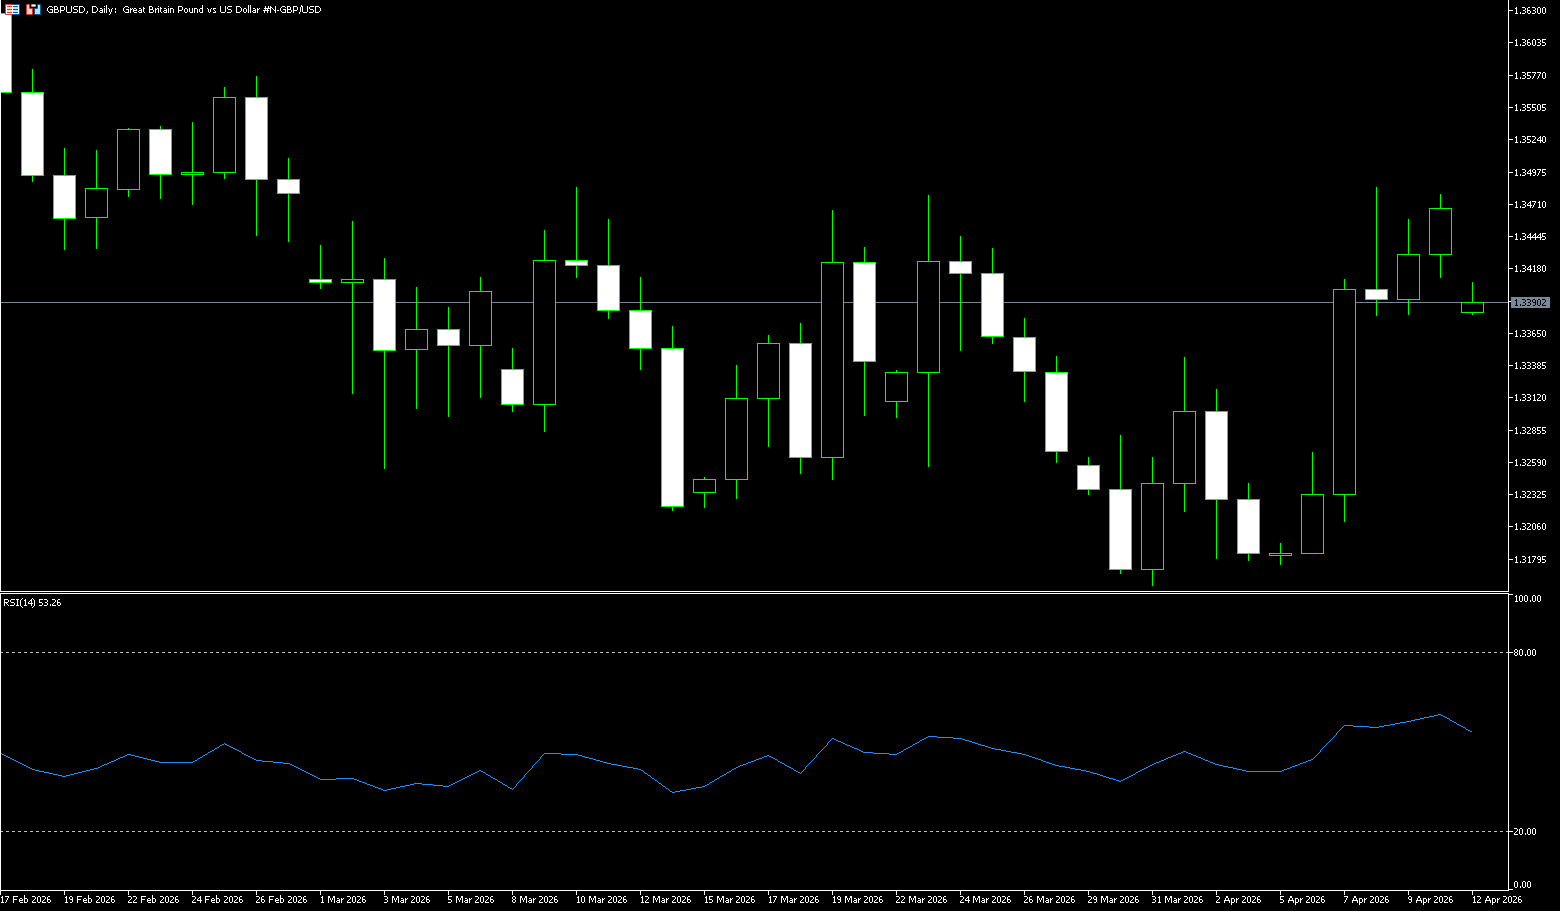
The pound stabilized around $1.34 last week, and while lacking follow-through selling, GBP/USD remains near its highest level since late February, reached earlier this week. The spot price is currently trading in the $1.3420-$1.3415 range and is expected to record strong gains this week. Investors are focused on the increasingly fragile US-Iran ceasefire agreement; additionally, tensions in the Strait of Hormuz are providing some support for the dollar, considered a key factor putting pressure on GBP/USD. Israel launched its worst airstrikes to date on Lebanon, resulting in hundreds of casualties and triggering threats of retaliation from Iran. Tehran ruled out further peace talks with the US, and the continued blockade of the Strait of Hormuz exacerbated the already fragile ceasefire agreement, pushing oil prices higher. US President Donald Trump announced that US troops will continue to be deployed near Iran until a "real deal" is reached, further increasing uncertainty. Amid these developments, financial markets are anticipating an increased likelihood of further interest rate hikes from the Bank of England, with at least one hike expected by the end of 2026. Meanwhile, traders have significantly reduced their bets on a Bank of England (BoE) rate hike, now expecting a 30-40 basis point increase by the end of the year. This diverges significantly from the Federal Reserve's signals of one rate cut by the end of this year and another in 2027. This, in turn, benefits GBP/USD bulls, but caution is advised before further declines.
The technical chart for GBP/USD last week showed a strong rebound from its lows, followed by a period of consolidation at higher levels. The overall trend was slightly bullish, but upward movement faces key resistance, and a pullback risk should be noted. GBP/USD rebounded strongly from the early-week low of around 1.3180, breaking through the 1.3300 and 1.3400 levels, reaching a high of 1.3484 mid-week, before consolidating above 1.3400. Currently, GBP/USD remains in a downtrend from the January high of 1.3870, but last week's rebound has initially eased the weakness. The exchange rate has stabilized above its short-term moving averages, but volatility is converging, indicating a tug-of-war between bulls and bears. Technical indicators have improved, with the MACD indicator crossing above its signal line and rising back towards zero, while the 14-day Relative Strength Index (RSI) is at 57.35, showing moderate bullish momentum and not overbought. The short-term bias is slightly bullish, as the pair is holding above the 38.2% Fibonacci retracement level of the January-March decline. The spot price is currently testing the downward-sloping 200-day simple moving average at 1.3413, indicating buying interest on dips near this long-term reference point. Further upside could face immediate resistance at 1.3484 (last week's high) and the 50% Fibonacci retracement level at 1.3505. A daily close above this resistance would strengthen the bullish tone and open up potential for a move towards the 61.8% Fibonacci retracement level at 1.3588, as well as the psychological level of 1.3600. Initial support lies at the 200-day moving average at 1.3413. A break below this level would expose the 23.6% Fibonacci retracement level at 1.3319, and the psychological level of 1.3300 as the next support. As long as the GBP/USD exchange rate holds above the 200-day simple moving average support zone of 1.3413, the path of least resistance leans towards further gains, targeting the 1.3588 area.
Today, consider going long on GBP at 1.3450, with a stop-loss at 1.3440 and targets at 1.3500 and 1.3520.
USD/JPY
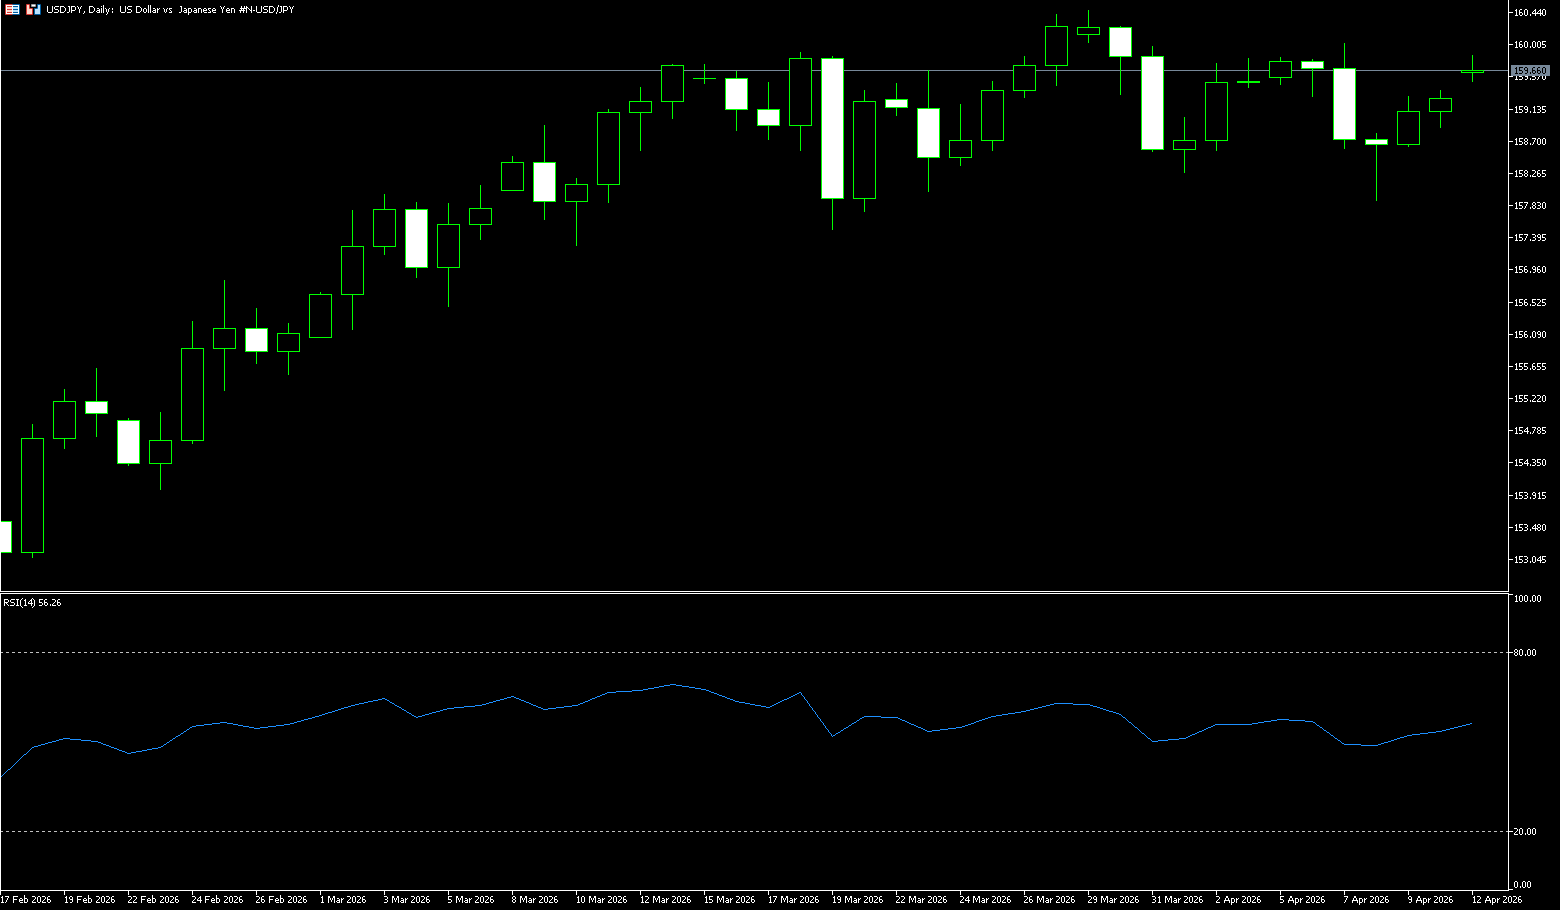
The USD/JPY pair rebounded from a low below 158 to around 159 last week. The yen was under significant pressure due to the volatile situation in the Middle East and energy transportation risks. Although the Fed's dovish stance limited the dollar's upside, short-term safe-haven demand continued to support the dollar's performance, resulting in an overall volatile but slightly bullish trend. From a fundamental perspective, uncertainty in the Middle East has increased significantly. Despite the temporary ceasefire agreement reached between the US and Iran, the situation quickly reversed. Israel launched a large-scale operation in Lebanon, raising questions about the ceasefire's sustainability, while Iran also stated that the ceasefire clauses had been violated. These developments put renewed pressure on market risk appetite, leading to a shift of funds towards safe-haven assets such as the dollar, thus supporting a stronger dollar index. Meanwhile, energy transportation risks have become a crucial variable affecting the yen. Reports indicate that shipping through the Strait of Hormuz was temporarily disrupted after the escalation of the conflict. Given Japan's high dependence on Middle Eastern crude oil imports, market concerns about energy supply disruptions impacting the Japanese economy further weaken the yen. Japan's structural reliance on energy imports often puts the yen under pressure during periods of rising energy risk. Against this backdrop, the USD/JPY pair receives dual support: the dollar's safe-haven appeal strengthens, while the yen's fundamentals are under pressure. This combination of a strong dollar and a weak yen has driven the exchange rate higher in the short term. Market sentiment is currently characterized by a wait-and-see approach. On one hand, geopolitical uncertainties bring volatility risks; on the other hand, key macroeconomic data is yet to be released, leaving the market lacking a clear direction. Therefore, the exchange rate is more likely to exhibit a volatile trading pattern in the short term.
Last week, the USD/JPY pair was generally in a technical pattern of high-level consolidation, weakening bullish momentum, and increased risk of a pullback. The weekly chart shows weak selling pressure, with a short-term bias towards a downward trend. On the other hand, the current USD/JPY movement exhibits typical multi-factor driven characteristics. In the short term, the volatile situation in the Middle East and rising energy risks have strengthened the dollar's safe-haven appeal while suppressing the yen's performance, driving the exchange rate rebound. However, in the medium term, the potential path of interest rate cuts by the Federal Reserve limits the upside potential of the dollar, making it difficult for the exchange rate to form a one-sided trend. Future movements will depend on the evolution of the geopolitical situation and the performance of US inflation data. Before key variables become clear, the exchange rate is likely to maintain a volatile but slightly bullish pattern. The long-term bullish trend remains unchanged, with USD/JPY trading above all moving averages; the MACD is below the zero line, and the RSI is neutral to weak. Upward momentum is waning, with the Stochastics/RSI falling back after approaching overbought territory. From a technical perspective, the daily chart shows that USD/JPY found support and rebounded after retracing below 158, and is still in a consolidation phase within a medium-term uptrend. Currently, the exchange rate has risen back above the 40-day moving average at 157.91 and the 158.00 (psychological level) area, indicating a recovery in bullish strength, but significant resistance remains at 159.20 (the 20-day moving average). A successful breakout could lead to further testing of the 160.00 psychological level and the 160.03 area (last week's high). A break above this level would target the year's high of 160.46, with a further target of the 161.05 (key weekly resistance) – 161.50 area. On the downside, the 40-day moving average at 157.91 and the 158.00 psychological level form key short-term support. A break below this level could lead to a retest of the 157.40 area, which is the intersection of the previous consolidation base and the channel projection.
Today, consider shorting the US dollar at 159.50, with a stop loss at 159.70 and targets at 158.60 and 158.40.
EUR/USD
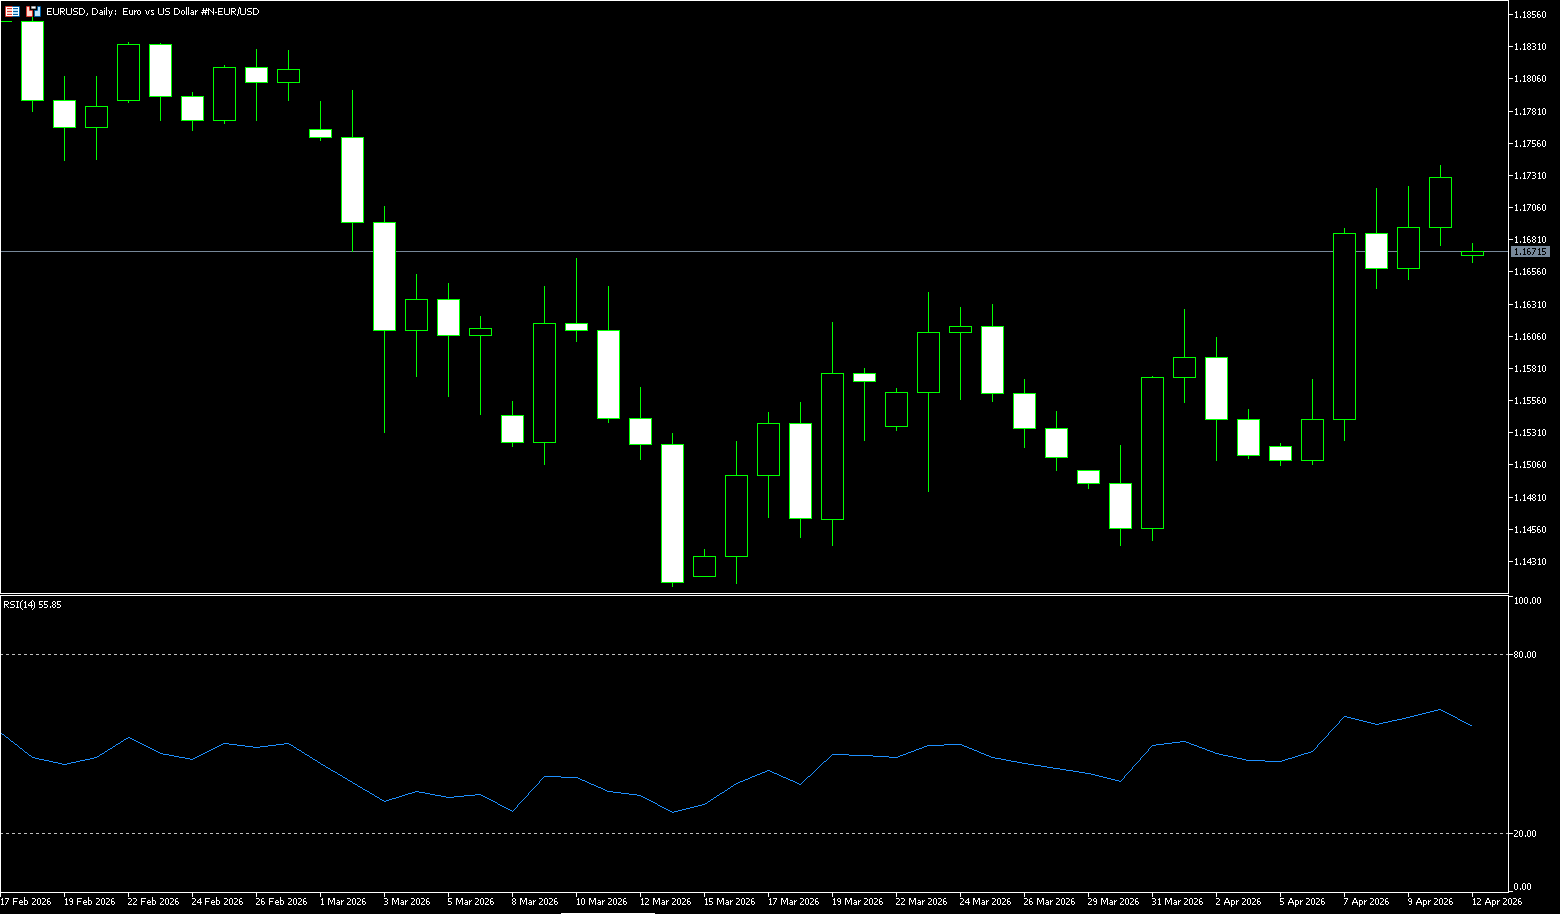
Last week, EUR/USD traded in a weak range around 1.1690. The euro weakened against the dollar as traders remained cautious about the sustainability of the fragile two-week ceasefire agreement between the US and Iran. Earlier last week, the rebound in the euro against the dollar was essentially a result of broad-based pressure on the dollar, rather than an improvement in the Eurozone's own fundamentals. The recovery in global risk appetite directly weakened the dollar's safe-haven appeal, leading investors to sell dollars and allocate to higher-yielding assets, causing the dollar index to fall in tandem. The rise in S&P 500 futures further confirmed this market dynamic; rising risk asset prices are typically accompanied by a relative decrease in dollar funding costs. The reopening of the Strait of Hormuz, a key energy corridor, alleviated concerns about potential supply disruptions and reduced the global uncertainty premium. This sentiment was transmitted to the foreign exchange market, causing the euro against the dollar to break free from purely fundamental constraints and exhibit typical cross-market correlation. Traders should note that such risk-driven market movements are often highly volatile, and if related events recur, the dollar may quickly recover its losses. As a traditional safe-haven currency, the demand for the dollar naturally weakens when uncertainty decreases, leading to a passive rise in the euro against the dollar. This transmission mechanism manifests in the foreign exchange market as a synchronized adjustment in the dollar index, rather than a change in Eurozone policy expectations. Traders observed that geopolitical easing events typically amplify the impact of risk appetite on major currency pairs, especially when the US dollar index is already at a relatively low level, where the amplification effect is more pronounced. Meanwhile, weak retail sales reflect the continued fragility of domestic demand in the Eurozone. While Eurozone data itself showed insufficient economic resilience, it did not trigger adjustments to the European Central Bank's policy expectations, thus limiting the marginal impact on exchange rates.
Last week, the euro traded within a narrow range against the US dollar, with a slightly bullish bias. The core trading range was 1.1600-1.1700. Short-term bulls held an advantage, but momentum was insufficient, requiring a break above key resistance to confirm a continuation of the trend. The euro rebounded from a low near 1.1505 during the week, recovering the 20-day consolidation within the 1.1600-1.1700 range, temporarily halting the medium-term downtrend. Regarding the moving average system, the short-term (May 10th/20th) trend is bullish, with 1.1620-1.1650 acting as a strong support zone; the 50-day moving average is around 1.1525, providing support for the week's low. The 14-day RSI is in the 55-60 range, neutral to bullish, and not overbought; the MACD lines have formed a golden cross below the zero line, indicating initial bullish momentum. The Euro/USD pair closed higher for the second consecutive week near the 1.1700 level, with alternating gains and losses reflecting US President Trump's comments on the Middle East war. Financial markets are focused on the Iran war, paying little attention to key US employment data. Pessimistic sentiment supporting the dollar is spreading. Initial support is at the 40-day simple moving average around 1.1631, followed by 1.1600 (a psychological level); continued weakness could lead to lower levels. The first resistance level is at 1.1723 (last week's high). A break above this level would open up space towards 1.1795 (March 2nd high) and the psychological level of 1.1800, the latter being the convergence point of the broader recent bearish trendline. A sustained hold above this upper trendline would strengthen the bullish scenario.
Consider going long on the Euro today at 1.1712, with a stop-loss at 1.1700 and targets at 1.1760 and 1.1780.
Disclaimer: The information contained herein (1) is proprietary to BCR and/or its content providers; (2) may not be copied or distributed; (3) is not warranted to be accurate, complete or timely; and, (4) does not constitute advice or a recommendation by BCR or its content providers in respect of the investment in financial instruments. Neither BCR or its content providers are responsible for any damages or losses arising from any use of this information. Past performance is no guarantee of future results.
More Coverage


Risk Disclosure:Derivatives are traded over-the-counter on margin, which means they carry a high level of risk and there is a possibility you could lose all of your investment. These products are not suitable for all investors. Please ensure you fully understand the risks and carefully consider your financial situation and trading experience before trading. Seek independent financial advice if necessary before opening an account with BCR.
BCR Co Pty Ltd (Company No. 1975046) is a company incorporated under the laws of the British Virgin Islands, with its registered office at Trident Chambers, Wickham’s Cay 1, Road Town, Tortola, British Virgin Islands, and is licensed and regulated by the British Virgin Islands Financial Services Commission under License No. SIBA/L/19/1122.
Open Bridge Limited (Company No. 16701394) is a company incorporated under the Companies Act 2006 and registered in England and Wales, with its registered address at Kemp House, 160 City Road, London, City Road, London, England, EC1V 2NX. This entity acts solely as a payment processor and does not provide any trading or investment services.

 English
 简体中文
简体中文
 繁體中文
繁體中文
 Bahasa
Melayu
Bahasa
Melayu
 Tiếng
Việt
Tiếng
Việt
 ไทย
ไทย
 日本語
日本語
 한국어
한국어
 ភាសាខ្មែរ
 español