


0
Currency & Commodity Analysis:
US Dollar Index
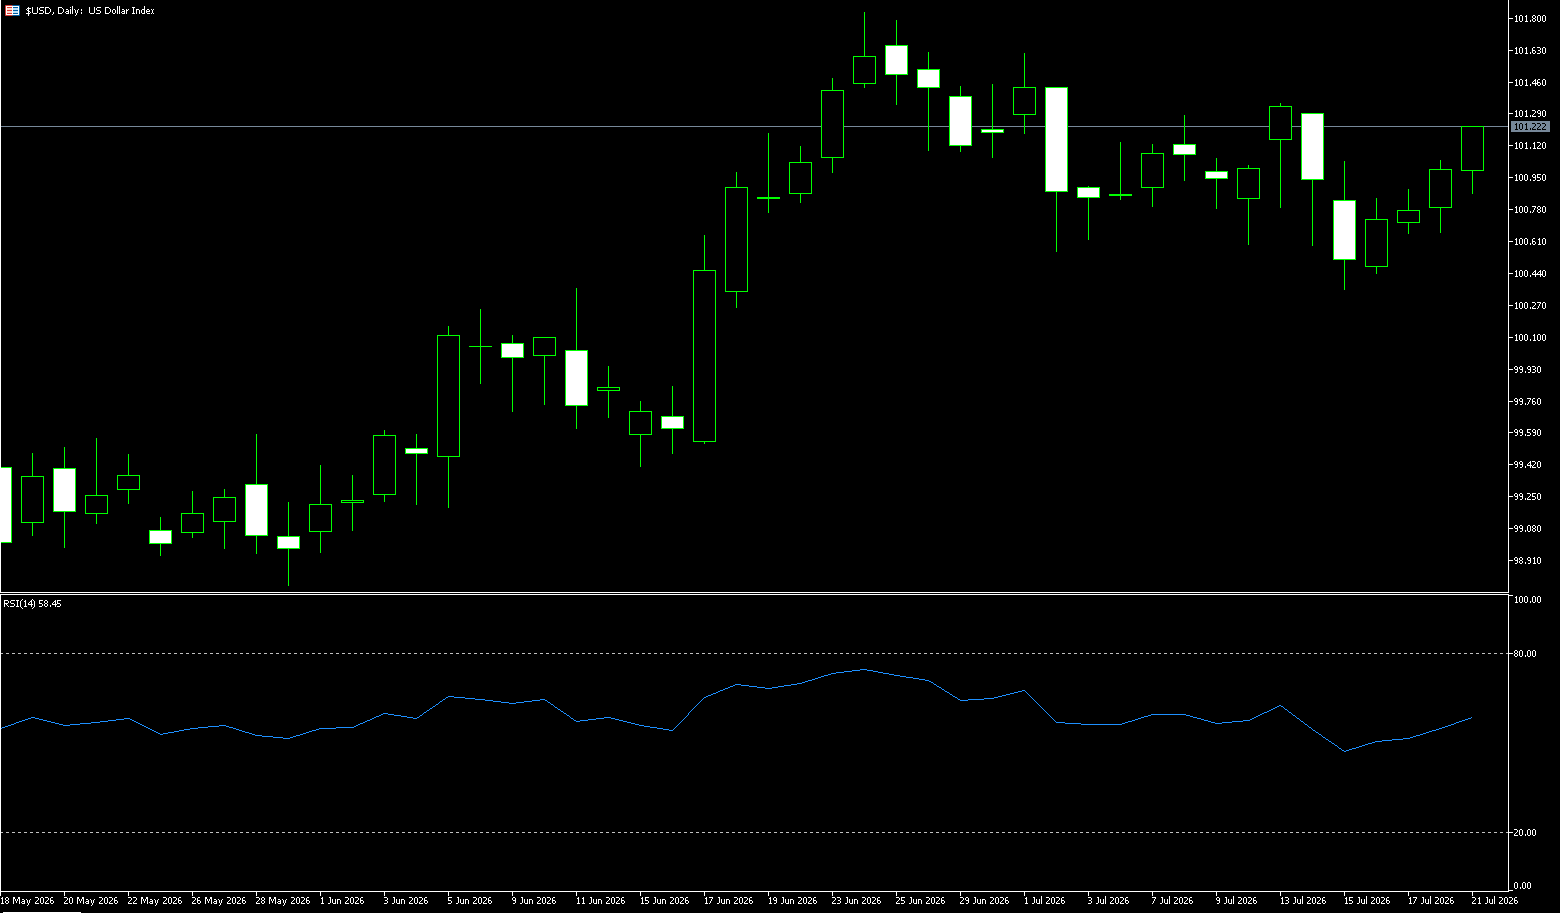
The US dollar index rose to 101.18 on Tuesday, its highest level in nearly a week, as investors continued to assess developments in the Middle East and the renewed rise in oil prices. Inflation concerns resurfaced due to escalating tensions between the US and Iran, with the two countries attacking each other for the tenth consecutive day. Regarding monetary policy, Federal Reserve Chairman Warsh has repeatedly emphasized that inflation remains a key concern for the central bank, a message echoed by several other Fed officials in recent weeks. Policymakers are now in their usual quiet period, preparing for next week's Federal Open Market Committee (FOMC) meeting, with the market widely expecting the central bank to maintain the federal funds rate. However, traders' expectations for further tightening after July remain high, with a roughly 68% probability of a rate hike at the September meeting.
The escalating conflict between the US and Iran has driven the dollar index higher for three consecutive days, trading around 100.90, driven by geopolitical safe-haven demand. Meanwhile, rising oil prices have exacerbated inflation concerns, and the market continues to bet on a possible Fed rate hike, supporting the dollar. Overall, the dollar is likely to maintain a high level of fluctuation in the short term. The daily chart of the dollar index shows that it rebounded after finding support near the 100 level and has now climbed back above the 101.00 area, indicating a short-term bullish structure. The first resistance level to watch is around 101.33 (the high of July 13th). A break above this level could lead to a further test of the psychological level of 102.00. On the downside, the first support level to watch is the 100.50 area, a key support level for the recent rebound. A break below this level could lead to a retest of the psychological level of 100.00. The daily moving average structure shows that the short-term momentum of the US dollar has improved, but a break above key resistance is still needed to confirm an upward trend.
Today, consider shorting the US Dollar Index at 101.28, with a stop loss at 101.38 and targets of 100.80 and 100.70.
WTI Crude Oil
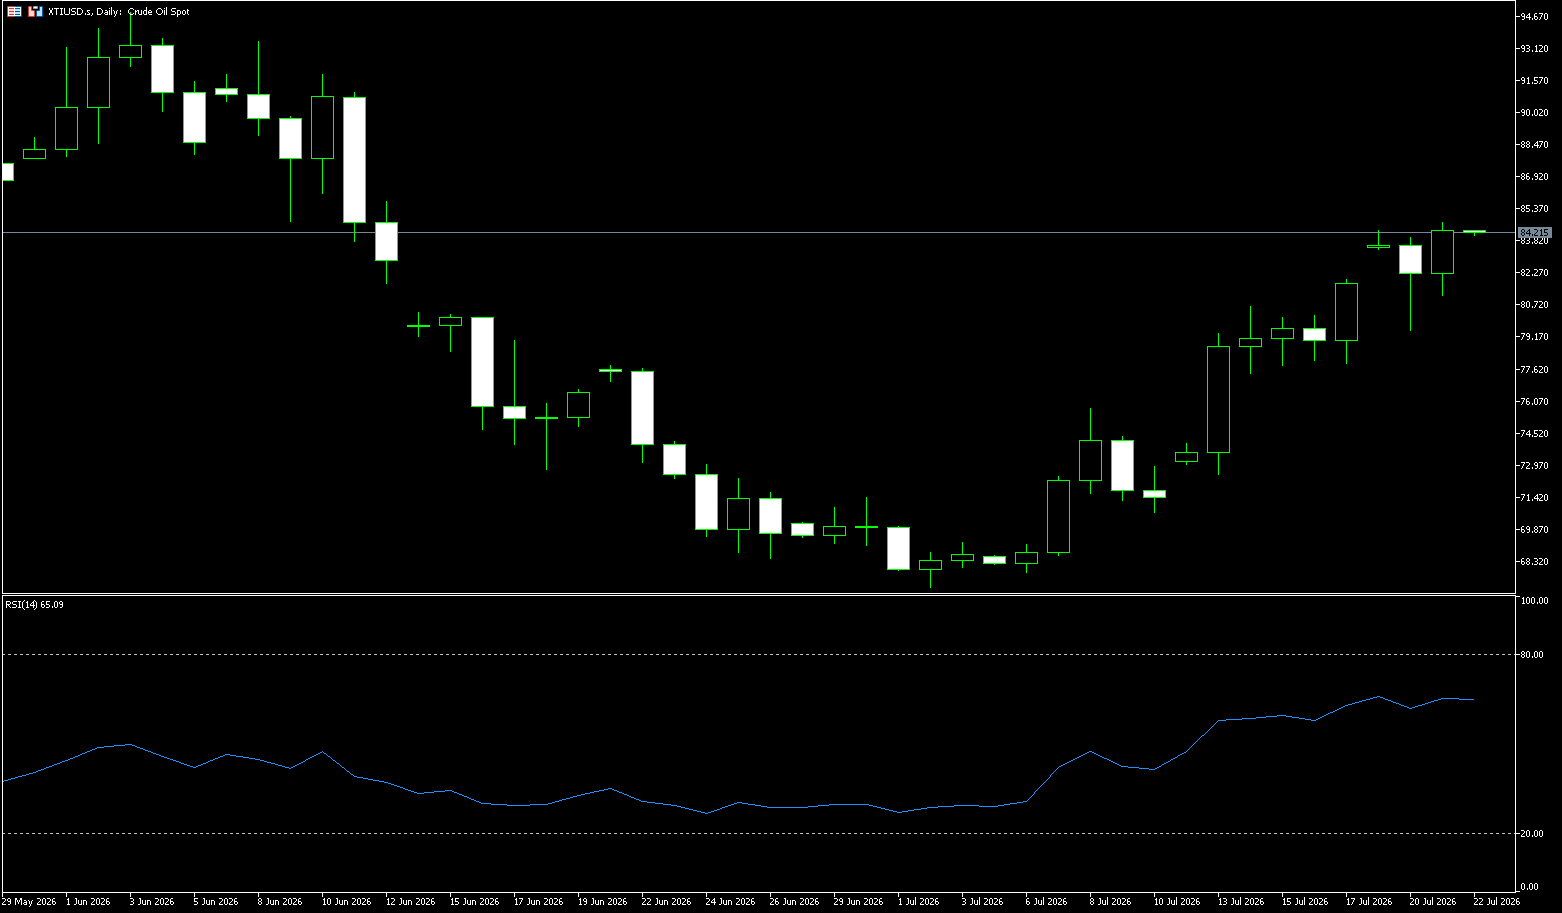
On Monday morning in Asian trading, US crude oil gapped up more than 3%, briefly touching a one-month high above $84.00 per barrel. Tensions between the US and Iran continued over the weekend, with the US issuing a global security alert, increasing geopolitical uncertainty. The Israeli military stated it was ready to resume operations against Iran at any time. On July 19, Israel Defense Forces Chief of Staff Zamir publicly stated that the IDF was closely monitoring Iranian missile launches and was prepared to resume operations against Iran at any time. This statement stemmed directly from the detection of Iranian missile launches towards Aqaba, Jordan, that day. The IDF immediately launched multiple anti-aircraft interceptors. Although missile debris ultimately landed near Eilat, the IDF's air defense system was on "high alert." Last week, the crude oil market experienced a dramatic repricing triggered by a geopolitical powder keg. WTI crude oil surged approximately 15% this week, with the pricing logic shifting abruptly from inventory and demand expectations to a risk premium model based on supply disruptions.
This week's oil price surge is essentially a concentrated release of geopolitical risk premiums. In the oversold area around $70, short covering and speculative long positions combined to push prices near the upper Bollinger Band resistance level. In the short term, the intensity of the US-Iran conflict remains the sole core variable influencing oil prices. WTI crude oil's price movement is highly synchronized with Brent crude, having previously surged to $113.28 before falling to $67.048, and then rebounding strongly to around $84 at the beginning of this week. Technically, the current price is between the upper Bollinger Band at $82.90 and the 100-day moving average at $87.80, with approximately $2 of room before reaching the psychological level of $90.00. The MACD histogram continues to expand, the DIFF line has crossed above the DEA, and the golden cross signal is clear, indicating a good continuation of the rebound trend. On the upside, the target is the 100-day moving average at $87.80 and the psychological level of $90.00. On the downside, watch the 45-day moving average at $81.26 and the $80.00 (psychological level) area.
Consider going long on crude oil today at $82.15, with a stop loss at $82.00 and targets at $85.00 and $84.00.
Spot Gold
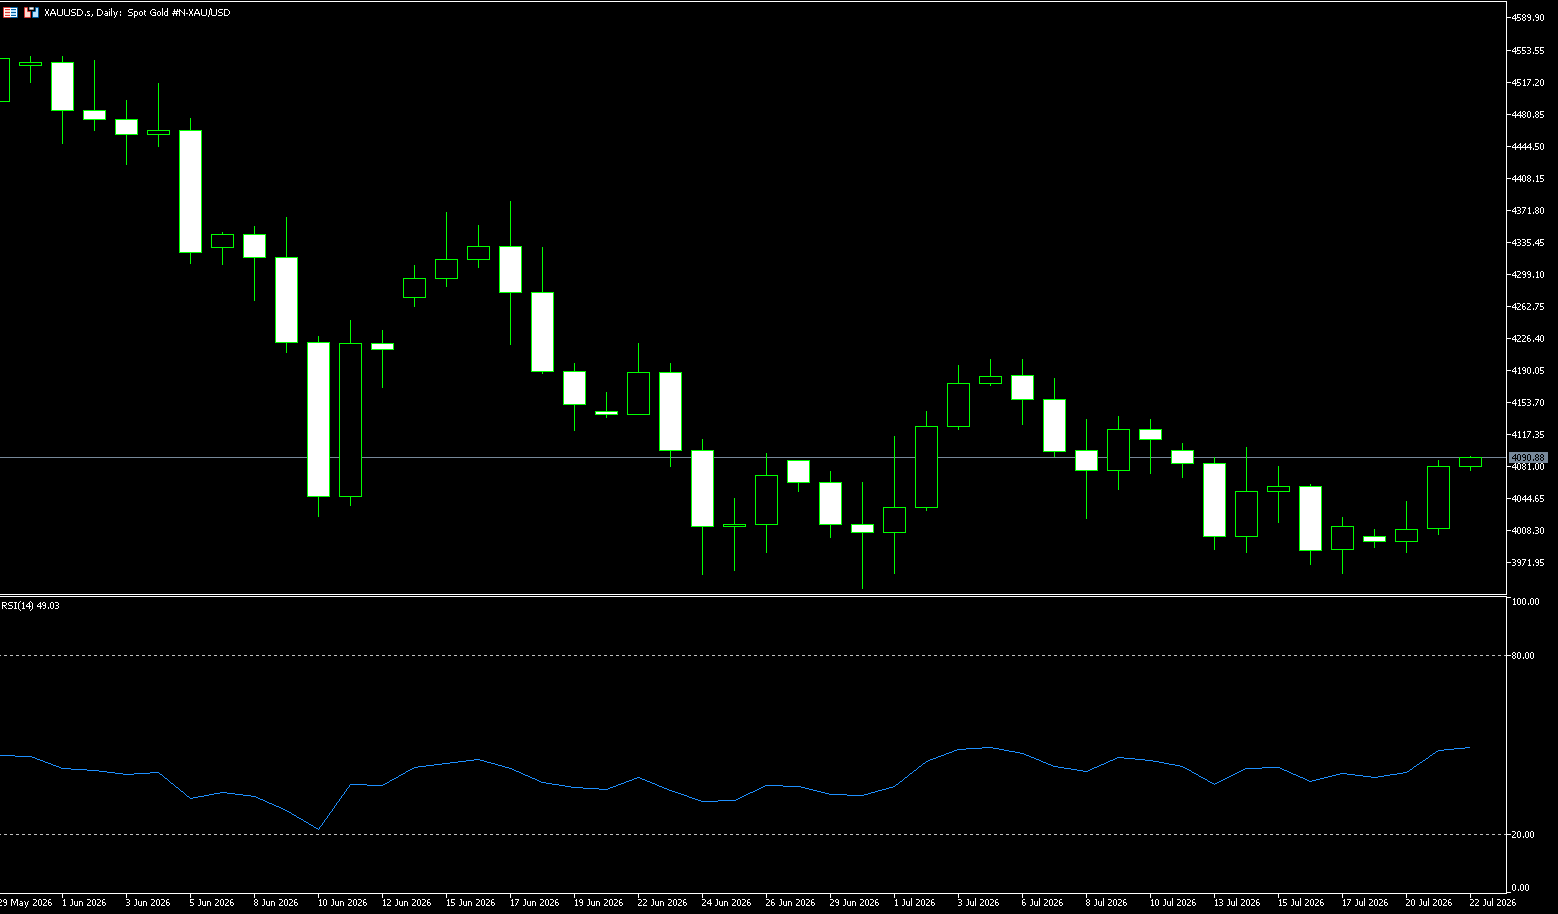
Spot gold weakened slightly on Monday, briefly falling below $4,000 to $3,982. It is currently trading around $4.010 per ounce. The escalating conflict between the US and Iran pushed oil prices up by more than 3%, exacerbating inflation concerns, and a stronger dollar put pressure on gold prices. Last week, gold recorded its biggest drop in six weeks, falling 2.5% cumulatively. Despite resilient economic data and rising expectations of a Fed rate hike, gold is technically severely oversold, with the $4,000 support level being repeatedly tested. Market opinions are divided, with short-term pressure prevailing, but a rebound catalyst may emerge in the summer. Geopolitical risks and policy maneuvering keep the future of gold uncertain. The US Energy Secretary stated that US military action against Iran will continue, and the US State Department issued a global security alert, increasing geopolitical uncertainty, exacerbating inflation concerns, boosting interest rate hike expectations, and limiting gold price gains. A stronger dollar and heightened global inflation concerns are the main drivers of the gold sell-off, pushing up global interest rates.
For investors, the $4,000 level has become a key psychological and technical level. Short-term volatility may continue, but from a medium- to long-term perspective, gold's intrinsic value as a hedge against inflation and uncertainty has not disappeared. Historical experience shows that in oversold conditions, any positive catalyst—whether a policy shift or an evolution of geopolitical events—can ignite a retaliatory rebound. After breaking below the key level last week, short-term bears have generally gained a technical advantage, and gold prices have remained below the psychological level of $4,000. The primary upside target for bulls is to reclaim the $4,000 level, and if it holds, look towards $4,050 (the 9-day moving average), with a further target of $4,100 (the psychological level). The short-term downside target for bears is a break below the $3,982 (Monday's low) support, with deeper targets at $3,943.70 (the June 30th low), and potentially further testing $3,820 (last October's low) and the $3,800 (psychological support level).
Today, consider going long on gold at $4,005, with a stop-loss at $4,000; targets: $4,060; $4,050.
AUD/USD
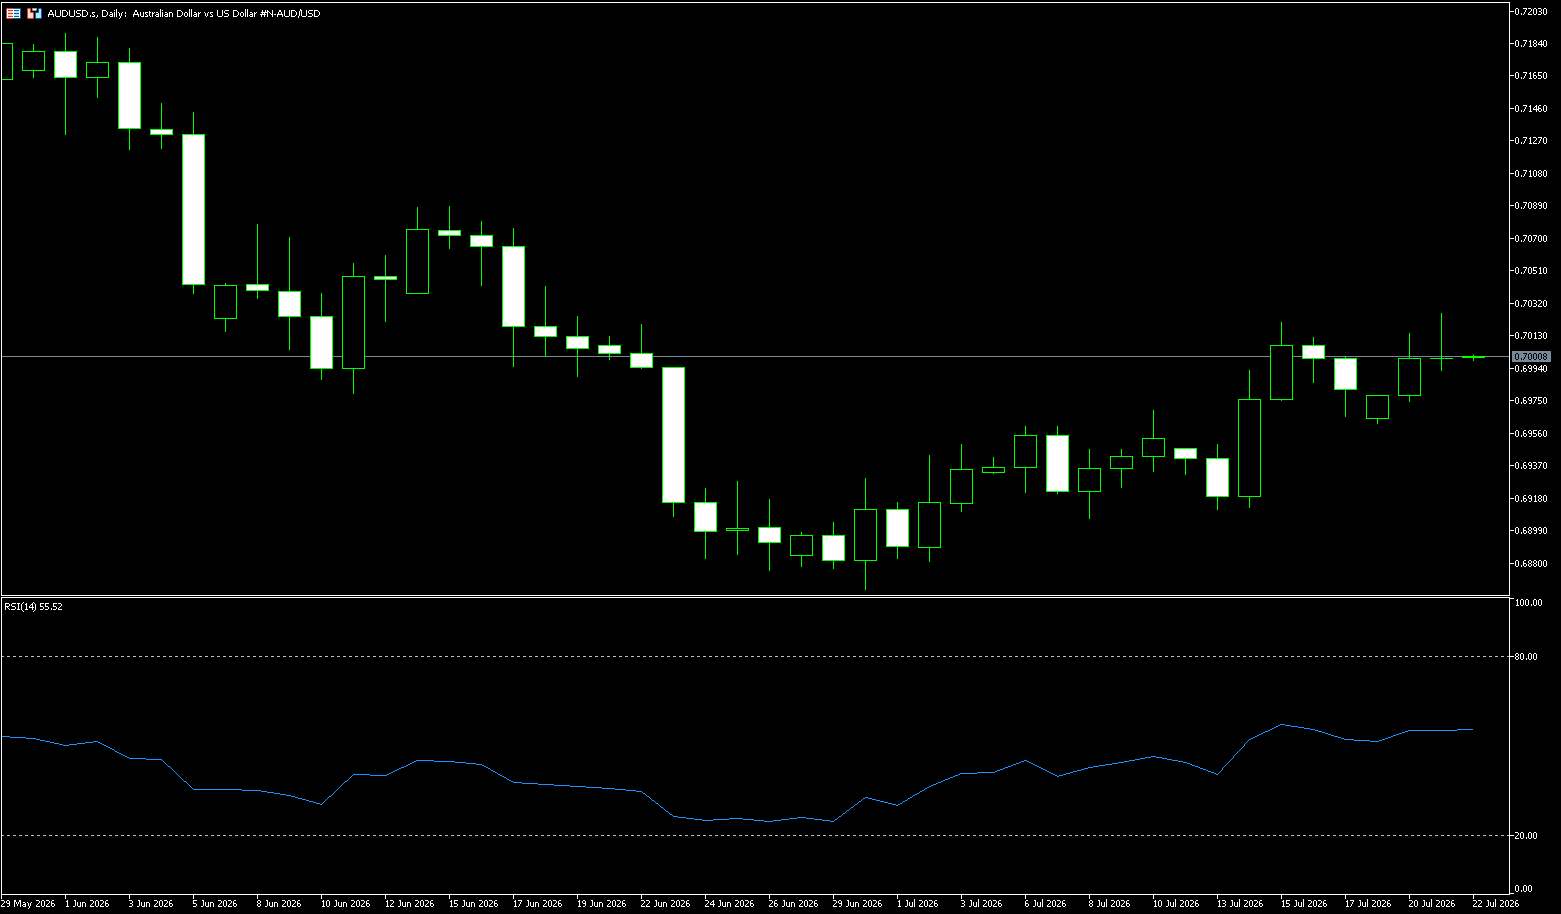
The Australian dollar rose above approximately 0.70 US dollars, reaching a four-week high, as the ongoing US-Iran conflict increased the risk of energy-driven inflation and strengthened market expectations that the Reserve Bank of Australia might raise interest rates again. The US attack on Iran entered its tenth day, and the Iranian-backed Houthi rebels also announced a maritime embargo against Saudi Arabia, increasing concerns about a wider disruption to global energy supplies. The surge in oil prices has further solidified market expectations that the Reserve Bank of Australia may tighten policy further after raising the cash rate three times to 4.35%, with the market pricing in an 80% chance of another rate hike by December. Investors are also awaiting Australia's June employment report, which forecasts an increase of 15,000 jobs and an unchanged unemployment rate of 4.4%. Weaker-than-expected labor market data could prompt traders to lower their expectations for further policy tightening.
The Australian dollar remains constructive in the big picture, but the upside path has become more difficult. The Reserve Bank of Australia is in no hurry to abandon its slightly hawkish stance. However, this support is being offset by a strong US dollar, ongoing geopolitical tensions, and a stable rather than accelerating Chinese economy. Currently, the psychological level around 0.7000 remains a key area. Holding this level would maintain a broader bullish structure, but a convincing break above 0.7000 would likely require sustained declines in US inflation, a more dovish stance from the Federal Reserve, or a significant improvement in global risk appetite. Upside targets to consider are 0.7060 (the 100-day simple moving average) and 0.7100 (the psychological level). Downside targets are the 0.6942 (21-day simple moving average) level and the 0.6889 (200-day simple moving average) level, where strong support is expected.
Consider going long on the Australian dollar at 0.6988 today, with a stop loss at 0.6978 and targets at 0.7030 and 0.7040.
GBP/USD
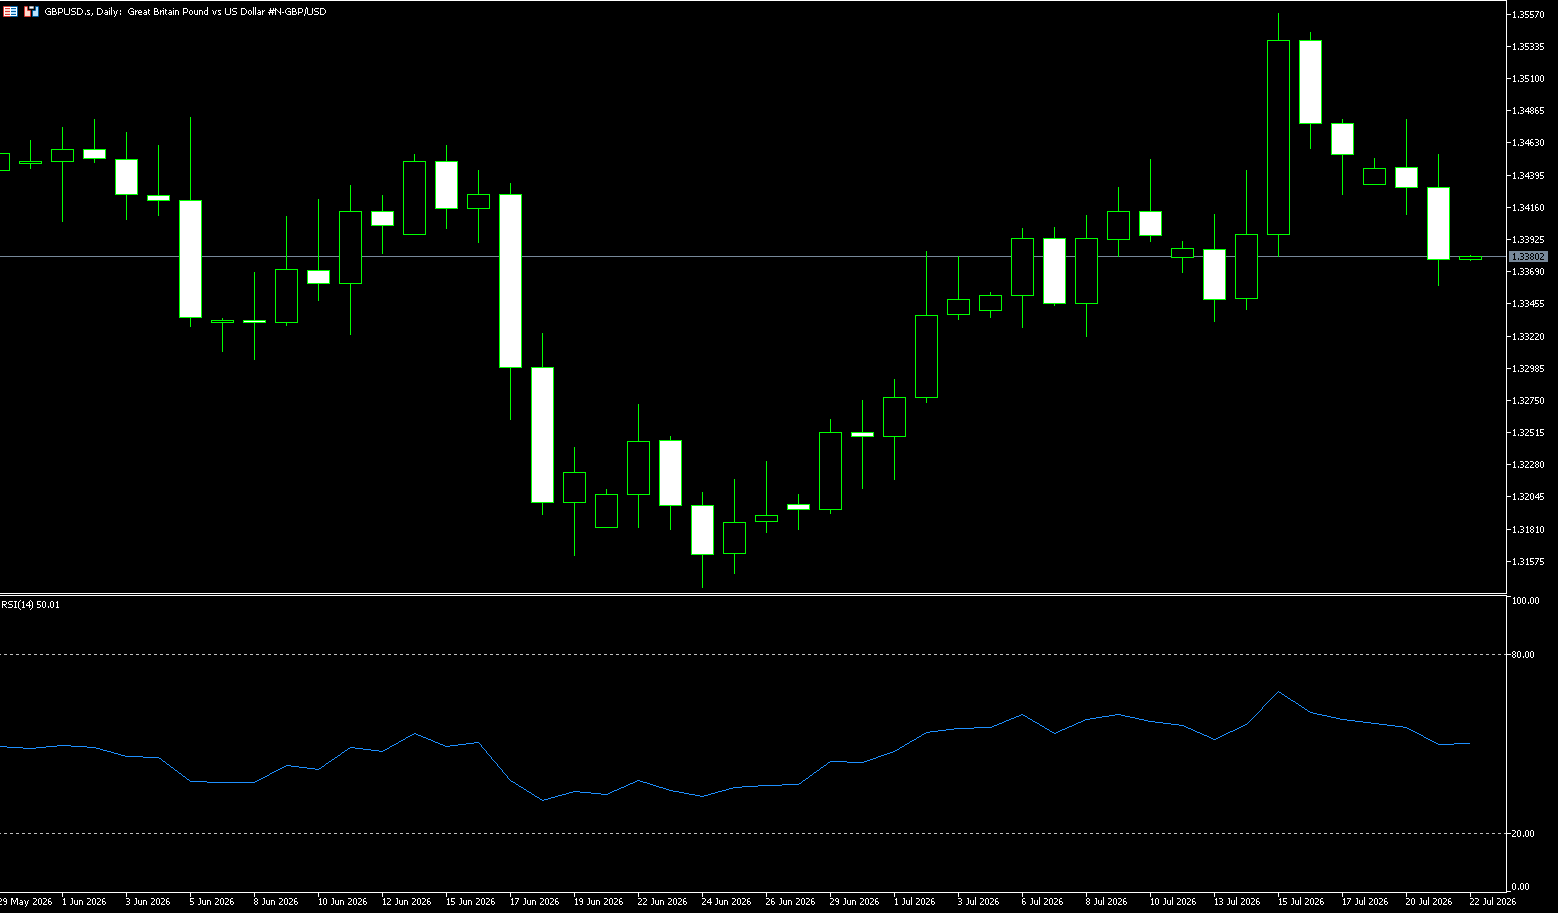
The GBP/USD pair continued its decline from Monday, briefly touching a five-day low near 1.3360 on Tuesday. The pound fell further, mainly due to a stronger dollar and uncertainty in the Middle East prompting investors to adopt a cautious stance. Meanwhile, a lackluster UK labor market report exacerbated the selling pressure on the pound. This followed Prime Minister Andy Burnham's unexpected appointment of former Defense Secretary John Healy as Chancellor of the Exchequer. Healy was an unexpected choice, not among the frontrunners, but his appointment may foreshadow increased defense spending in the future. On the policy front, Burnham has so far pledged to cut taxes on energy bills, funded by the cancellation of the digital identity scheme. At the same time, data from the Office for National Statistics showed that the UK government borrowed £16 billion in June. Investors are also focused on the Middle East situation, with renewed optimism regarding US-Iran diplomacy amid escalating regional tensions.
In the coming trading days, investors will focus on UK employment data, inflation reports, and retail sales performance. If the data shows a decline in the resilience of the UK economy, the market may lower expectations that the Bank of England will maintain high interest rates; conversely, if inflation remains stubborn, the pound may regain upward momentum. The GBP/USD daily chart shows that the exchange rate pulled back after approaching the 1.3558 area and is currently finding support around 1.3450. The overall trend remains within the previous rebound structure, but short-term momentum has clearly weakened. The key support level to watch is currently around 1.3350, which is close to the recent breakout area and short-term moving average support; a break below this level could lead to a further test of the 1.3300 level. On the upside, the first resistance level to watch is the psychological level of 1.3500; a break above this level could lead to another challenge of the previous high of 1.3558, with further resistance around 1.3600.
Today, consider going long on GBP at 1.3368, with a stop loss at 1.3358 and targets at 1.3420 and 1.3430.
USD/JPY
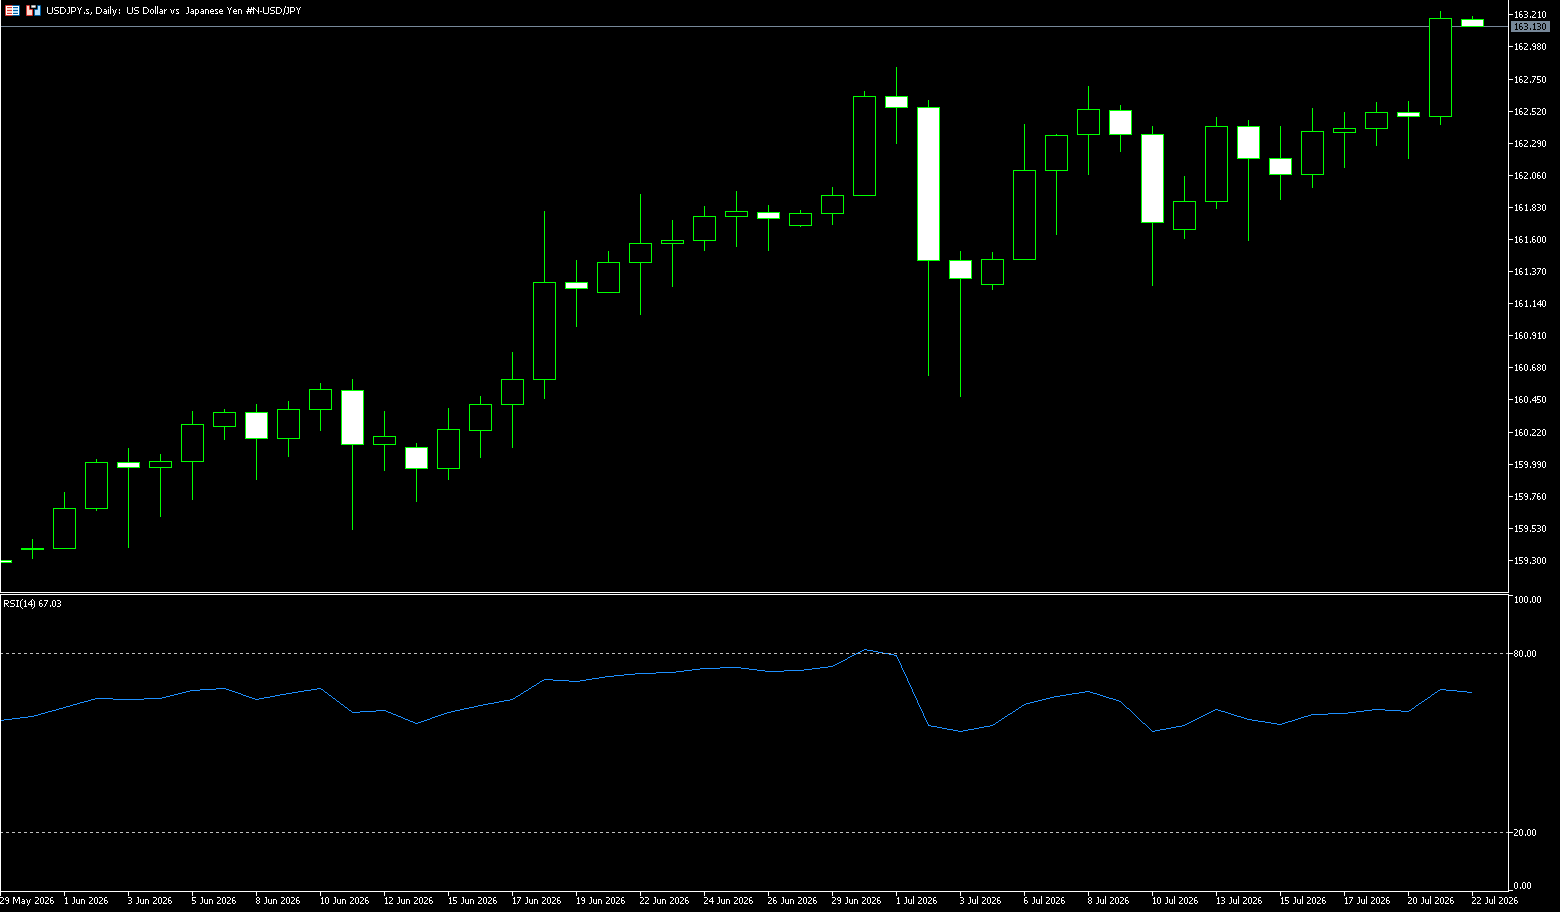
Selling pressure on the yen continued on Tuesday, pushing USD/JPY above the key 163.00 resistance level for the first time since December 1986. The pair's rise was based on a stronger dollar, rising US Treasury yields, and persistent geopolitical uncertainty. The yen traded around 162.5 per dollar on Tuesday, hovering near its weakest level since 1996, pressured by a stronger dollar and soaring oil prices due to escalating conflict in the Middle East. The US attack on Iran has entered its tenth day, with President Trump warning that Tehran will be responsible for the deaths of three US service members. The Iranian-backed Houthi rebels also announced a maritime embargo against Saudi Arabia, increasing concerns about energy shipments from the Red Sea. Japan's heavy reliance on Middle Eastern oil imports makes the yen particularly vulnerable to supply disruptions and rising energy costs. Investors have also seen little sign of decisive action from Tokyo to support the currency, while awaiting intervention data later this month for clues as to whether Japanese authorities were involved in the yen's sharp but short-lived rally in recent weeks.
The dollar/yen pair is trading at 163.20, holding a mildly bullish bias and consolidating near its multi-decade high of 162.84. The price is slightly above the 163.00 high, while the Relative Strength Index (RSI) median of 60-65 indicates robust but not excessive buying pressure. On the upside, the 127.2% Fibonacci retracement level of the early July pullback at 163.50 is immediate resistance; a break above this level would allow the pair to potentially test further upside, with 154.50 a reasonable target. On the downside, support is near the 162.84 level; a sustained break below this area would expose a deeper pullback risk, targeting the current uptrend starting point at 162.00.
Today, consider shorting the US dollar at 163.40, with a stop loss at 163.55 and targets at 162.70 and 162.60.
EUR/USD
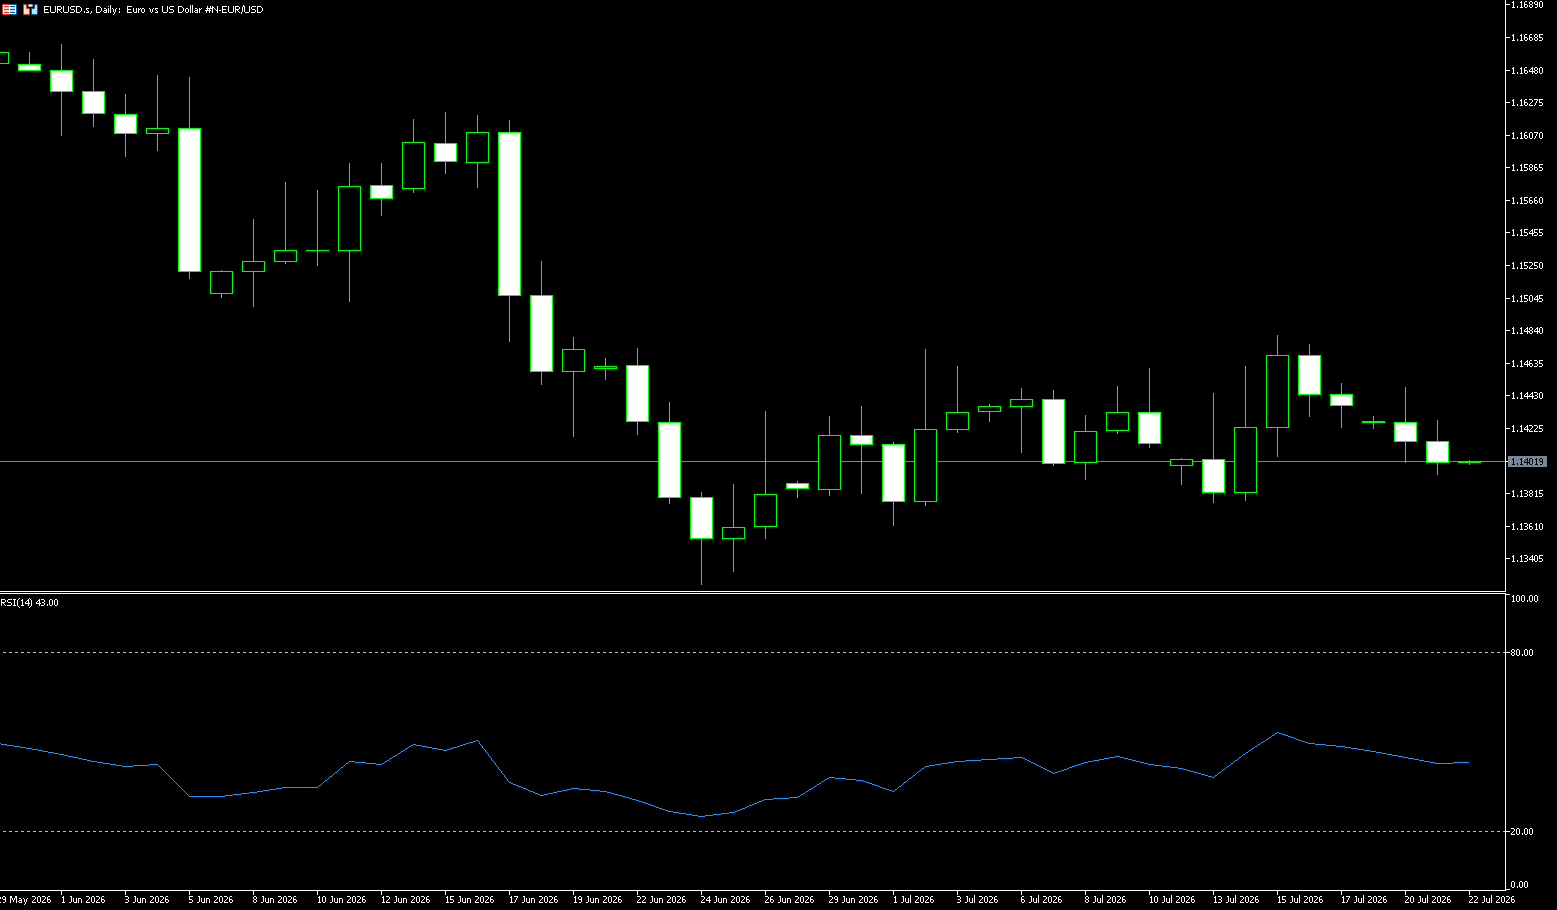
The EUR/USD pair consolidated above 1.1400 during Tuesday's European trading session. The pair lacked clear directional momentum due to a weak dollar and the upcoming German ZEW survey. The market is focused on Thursday's European Central Bank policy meeting. Following the June rate hike, the first in three years, policymakers are expected to maintain rates and adopt a cautious stance. However, the market still anticipates two additional ECB rate hikes by early 2027, primarily driven by rising oil prices, with the first hike potentially occurring in September. Meanwhile, investors are watching for a possible resumption of peace talks between the US and Iran following recent escalations. The ongoing tensions in the Middle East have raised concerns about oil supply disruptions, which could create inflationary pressures in Europe, a net energy importer, potentially pushing up bond yields.
The EUR/USD pair has maintained a bearish pattern after failing to break through the 1.1480-1.1485 area last week, which also coincides with the 20-day simple moving average at 1.1425. Furthermore, the MACD indicator remains below zero and in negative territory, while the 14-day Relative Strength Index (RSI) is at 45.43, still below the midline; momentum indicators collectively suggest weakening bullish momentum and a strengthening downward bias, with the EUR/USD pair continuing to be capped below the 55-day simple moving average at 1.1538. This, in turn, supports the possibility of an eventual break below the 1.1400 level and further down to the year-to-date lows, around the 1.1325 area reached on June 24th. On the upside, initial resistance lies at the Bollinger Band at 1.1470. A sustained break above this level to the 55-day simple moving average at 1.1538 is needed to alleviate current bearish pressure and pave the way for a more constructive outlook.
Today, consider going long on the Euro at 1.1390, with a stop-loss at 1.1380 and targets at 1.1450 and 1.1460.
Stock Analysis:
Australian ASX 200 Stock Index
Basic Market Overview:
The Australian Securities Exchange (ASX) 200 index was nearly flat on Tuesday, closing at 8793 points, marking its third weak trading day. Gains in non-energy minerals, technology, and energy minerals offset losses in healthcare, retail trade, and financials. Traders were anticipating Australian labor market data, as strong job growth in May contrasted with near four-year-high unemployment. Markets recovered from early losses as US stock index futures strengthened on reports of a Middle East settlement, with President Trump indicating he was considering a 10-day ceasefire to reopen the Strait of Hormuz. In major trading partner China, officials pledged to meet full-year growth targets despite weak second-quarter results, expected ahead of the Politburo meeting at the end of July. Nextdc surged 8.0% on rising utilization.
Energy stocks also rose, driven by Woodsside Energy (1.1%) and Origin Energy (1.3%). On the other hand, the four major banks fell between 0.6% and 1.5%, while Pro Medicus (-3.3%), Sonic Healthcare (-2.7%), and PLS Group (-1.9%) also dragged down the market.
Sector Performance:
The market closed down approximately 0.1% to 0.3% for the week, marking its second consecutive week of weakness; defensive and oil and gas sectors performed strongly across the board, while resource mining and technology sectors significantly dragged down the index.
This Week's Leading Sectors (from strongest to weakest)
Leading Sectors (ranked by closing gain)
1. Information Technology (IT) +3.26% (Strongest performer)
Core Drivers: Recovery in Asia-Pacific tech stocks, better-than-expected demand for data center computing power;
Leading Stocks: NEXTDC +7.74%, Megaport +5.1%, Evolution Mining, Xero, Technology One strengthened
2. Materials +1.33% Rising copper and gold prices boosted resource stocks; South32's Q1 results significantly exceeded expectations, surging 5.76%; gold and copper mines rebounded across the board; BHP, Capstone Copper, and Sandfire rose, while lithium mining stocks weakened and diverged.
3. Real Estate Investment Trusts (REITs) +0.58% Slight inflow of safe-haven funds, moderate gains
4. Energy: Middle East geopolitical tensions boosted oil prices, with Woodside up 1.1%, Origin up 1.3%, and Yancoal up 2.6%, while only Santos saw a slight pullback.
Leading Sectors (Ranked by Closing Decline)
5. Healthcare -1.05% (Worst Performing) Dragged down by institutional rating downgrades; Pro Medicus fell 3.3%~5.6%, Sonic Healthcare -2.7%, CSL also weakened.
6. Communications -0.87% Lacking positive news, all sectors under pressure.
7. Consumer Discretionary -0.83% Automotive and tourism sectors led the decline: Eagers Automotive -3.82%, Event Hospitality -3.76%.
8. Financials -0.71% (Largest Drag on the Index) All four major banks closed lower: ANZ -1.43%, NAB -1.36%, Westpac -1.34%, CBA -0.59%; Insurance and financial stocks also retreated, with significant profit-taking in previous periods.
Technical Analysis:
The ASX200 closed at 8,793.3 on Monday, up 0.02%. Intraday structure: The index dipped to a two-week low of 8,733 in the morning, a maximum drop of 58 points; it recovered in the afternoon, reaching a high above 8,800, before slightly retreating to close flat. The day saw wide fluctuations and intense battle between bulls and bears, maintaining an overall high-level consolidation pattern. The index opened lower due to overnight weakness in US stocks and Middle East geopolitical concerns, with financials, healthcare, and consumer sectors dragging it down. In the afternoon, Asia-Pacific technology and commodities strengthened, with strong gains in IT and resource sectors offsetting the bearish pressure, ultimately resulting in a flat close. Market sentiment is cautious, awaiting Australian employment data on Thursday and domestic policy signals at the end of July. The candlestick pattern: a long lower shadow doji, indicating some buying interest after the dip, but the bulls were unable to recover the day's losses, suggesting continued consolidation without a clear directional trend. Trading volume: Volume decreased, indicating a sideways market with both bulls and bears remaining cautious, awaiting guidance from Thursday's Australian employment data, US Treasury yields, and commodity prices. RSI (14-day): 48, neutral range, no significant overbought or oversold conditions; after touching the oversold threshold of 42 in the morning session, it quickly rebounded, indicating decent support below, but insufficient upward momentum. The index is trading near the 20-day moving average, with short-term moving averages intertwined and flattening, typical of a sideways market; the 5/10/20-day moving averages are converging at 8,770–8,785, forming a short-term support/resistance level.
Trading Strategy:
The following are technical trading ideas only and do not constitute investment advice. Leveraged trading may result in losses exceeding the principal.
Short-term Long Position (Buy on dips, relatively conservative)
Entry Range
• Preferred Entry: 8735–8750 (Enter after a pullback and stabilization near today's low, confirmed by a bullish 4-hour close)
• Second Add-on: 8690–8710 (Lower boundary of the trading range, higher safety margin)
Stop Loss
Unified Stop Loss: 8625 (Exit if the price breaks below the trading range's support level to avoid a deep pullback)
Profit Targets
1. First Profit Target: 8800–8810 (Reduce half of the position to realize profits at the upper boundary of the range)
2. Second Profit Target: 8860–8880 (Remaining position to watch for a breakout above the upper boundary of the range)
3. Swing Target: Hold if the price stabilizes above 8880, targeting 8980
Short-term Short Position (Sell on dips, betting on a pullback within the range)
Entry Range
Price rebound to Shorting opportunities arise at 8805-8815, with a long upper shadow on the 4-hour chart and the RSI turning downwards.
Stop Loss: 8870 (Breaking through the upper boundary of this week's trading range invalidates the bearish logic).
Profit Targets:
1. First Profit Target: 8740-8750 (Close most positions near the intraday low).
2. Second Profit Target: 8685-8700 (Exit all positions at the lower boundary of the trading range).
3. Extreme Downside: Hold if it breaks below 8730, targeting 8630.
Key Risk Warnings:
Overnight performance of the Nasdaq/S&P 500, with the strength or weakness of the technology sector directly impacting the ASX technology sector;
The sustainability of gold, copper, and iron ore prices determines whether resource-heavy stocks can continue to support the index;
Battle for the 8800 level: A direct breakout in the morning session would give the bulls the upper hand; repeated pressure and pullbacks would continue the downward trend, testing the 8730 support level.
Japanese Stock Market Index (JP225)
Basic Market Overview:
The Nikkei 225 index rose 3.26% to close at 66,231 points, while the broader Topix index gained 2.44% to 4,015 points, recovering most of last week's losses on Tuesday as investors returned from the extended holiday weekend, led by technology stocks. Recent sell-offs in semiconductor and artificial intelligence-related stocks eased as U.S. chipmakers recorded gains in overnight trading. Leading Japanese technology stocks included: Kioxia Holdings (17.2%), Advantest (7.7%), Taiyo Yuden (6.4%), SoftBank Group (6%), and Tokyo Electron (2.3%).
Financial and consumer stocks also rose, including Mitsubishi UFJ (3.1%), Sumitomo Mitsui (3.4%), and Fast Retailing (2.5%). Meanwhile, investors continued to focus on ongoing hostilities in the Middle East, which pushed up oil prices and reignited concerns about inflation and the possibility of interest rate hikes.
Sector Performance:
Leading Sectors (Two Tiers)
Absolute Main Theme: Semiconductors/AI Chips (Strongest Leading Sector of the Day)
Overnight, US chip stocks strengthened, coupled with a previous deep correction, leading to a broad-based rebound in memory, semiconductor equipment, and materials, driving the index upward:
Core Leading Stocks: Kioxia +17.18%, Ibiden +11.03%, Socionext +9.11%, Advantest, SoftBank Group, and Renesas Electronics saw significant gains.
Sub-sectors: Memory chips, semiconductor consumables, and AI computing power supporting materials led the market.
Cyclical + Financial Heavyweight Sectors (Top Performing Sectors)
Top 100 Sector Gains Ranking: Mining > Oil & Coal > Insurance > Other Financials > Banking
1. Mining: Resource cyclical stocks benefited from improved risk appetite, leading the market in gains.
2. Oil & Coal Products: Energy sector rebounded in tandem with oil price fluctuations.
3. Major Financial Sectors (Insurance, Banking, Integrated Financial Services): Mitsubishi UFJ, Sumitomo Mitsui, and Mizuho Bank all rose, providing support for the index.
4. Export Manufacturing and Retail Apparel (Uniqlo & Fast Retailing) followed suit.
Leading Sectors (Only 2 sectors closed lower across the entire market):
Other Products (Metal Products): The only sector to show significant weakness, with safe-haven funds flowing out.
Aquaculture & Agriculture: Consumer agriculture sectors closed slightly lower, the only two sectors to decline on the day.
Technical Analysis:
Current Market: Tuesday was the first trading day after Japan's three-day holiday. The index opened lower and then rebounded, reaching a high of 64,945 in the morning session and closing at 64,544, a daily increase of approximately 1.25%. This is a technical recovery rebound after last week's sharp decline, but the overall market remains within a medium-term correction channel, with weak rebound strength and heavy selling pressure above. Since the historical high of 72845 in June, the market has been in a mid-term downtrend, with a cumulative maximum pullback of over 11%, entering a technical correction phase. Tuesday's rebound was a weak rebound within the downtrend, defined as an oversold correction, and did not change the downtrend structure. After the rebound reaches its limit, the bears will dominate the market again. The leading sectors were memory chips (Kioxia) and cosmetics; games and semiconductor materials weakened, and the sector differentiation was obvious. The RSI (14) technical indicator is at 44.25, slightly rebounding from the oversold range, but has not entered the bullish range (above 55), indicating insufficient rebound momentum. It will encounter resistance and fall back when it approaches 50. The MACD: the two lines are below the zero axis, the green bars are narrowing, and only the bearish force has temporarily weakened, without a golden cross bullish signal. As for the trading volume: today's market was generally up (196 stocks rose, only 28 fell), indicating that bargain hunters entered the market, but the total volume did not increase significantly, and the sustainability of the rebound is questionable.
Trading Strategy:
Information is for market analysis reference only and does not constitute any trading or investment advice. Short-term bullish (playing the rebound and correction, quick in and out, no long-term holding)
• Entry conditions: Retracement to the 64000-64200 range and stabilization, 4-hour candlestick closes positive, RSI does not fall below 40
• Stop loss: 63400 (Exit immediately if it breaks below the intraday support, stop loss margin is about 600 points)
• Profit-taking levels:
TP1: 64900-65000 (20-day moving average resistance, first profit-taking, reduce position by 50%)
TP2: 66200-66400 (Gap resistance, exit all)
• Rule: After reaching 65000, regardless of whether the target is reached, gradually reduce the position, do not hold long-term long positions.
Short-term bearish (Core trend-following strategy, main medium-term approach)
• Entry range: 64900–65100 (touch the 20-day moving average and pull back; a long upper shadow appears on the 4-hour chart)
• Stop Loss: 65600 (Exit if short-term resistance fails to hold)
• Take Profit:
TP1: 64000
TP2: 63600
TP3: 62200 (Mid-term deep pullback target)
Risk Warning:
The rebound is a low-volume oversold correction with no continuous inflow of new funds, making it highly susceptible to a sharp rise followed by a fall. Chasing long positions is extremely risky and could lead to being trapped.
Index volatility has increased significantly, with daily fluctuations reaching 1800-2000 points. Leveraged trading is highly likely to trigger substantial losses and margin calls.
The mid-term downtrend structure remains intact. A single rebound does not indicate a trend reversal. Selling on rallies has a higher probability of success.
Disclaimer: The information contained herein (1) is proprietary to BCR and/or its content providers; (2) may not be copied or distributed; (3) is not warranted to be accurate, complete or timely; and, (4) does not constitute advice or a recommendation by BCR or its content providers in respect of the investment in financial instruments. Neither BCR or its content providers are responsible for any damages or losses arising from any use of this information. Past performance is no guarantee of future results.
More Coverage





Risk Disclosure:Derivatives are traded over-the-counter on margin, which means they carry a high level of risk and there is a possibility you could lose all of your investment. These products are not suitable for all investors. Please ensure you fully understand the risks and carefully consider your financial situation and trading experience before trading. Seek independent financial advice if necessary before opening an account with BCR.
BCR Co Pty Ltd (Company No. 1975046) is a company incorporated under the laws of the British Virgin Islands, with its registered office at Trident Chambers, Wickham’s Cay 1, Road Town, Tortola, British Virgin Islands, and is licensed and regulated by the British Virgin Islands Financial Services Commission under License No. SIBA/L/19/1122.
Open Bridge Limited (Company No. 16701394) is a company incorporated under the Companies Act 2006 and registered in England and Wales, with its registered address at Kemp House, 160 City Road, London, England, EC1V 2NX. Open Bridge Limited acts solely as a payment processor for BCR Co Pty Ltd and does not provide any financial, trading, or investment services on its behalf. Open Bridge Limited's role is limited to payment processing.


 English
 简体中文
简体中文
 繁體中文
繁體中文
 Bahasa
Melayu
Bahasa
Melayu
 Tiếng
Việt
Tiếng
Việt
 ไทย
ไทย
 日本語
日本語
 한국어
한국어
 ភាសាខ្មែរ
 español