


0
US Dollar Index
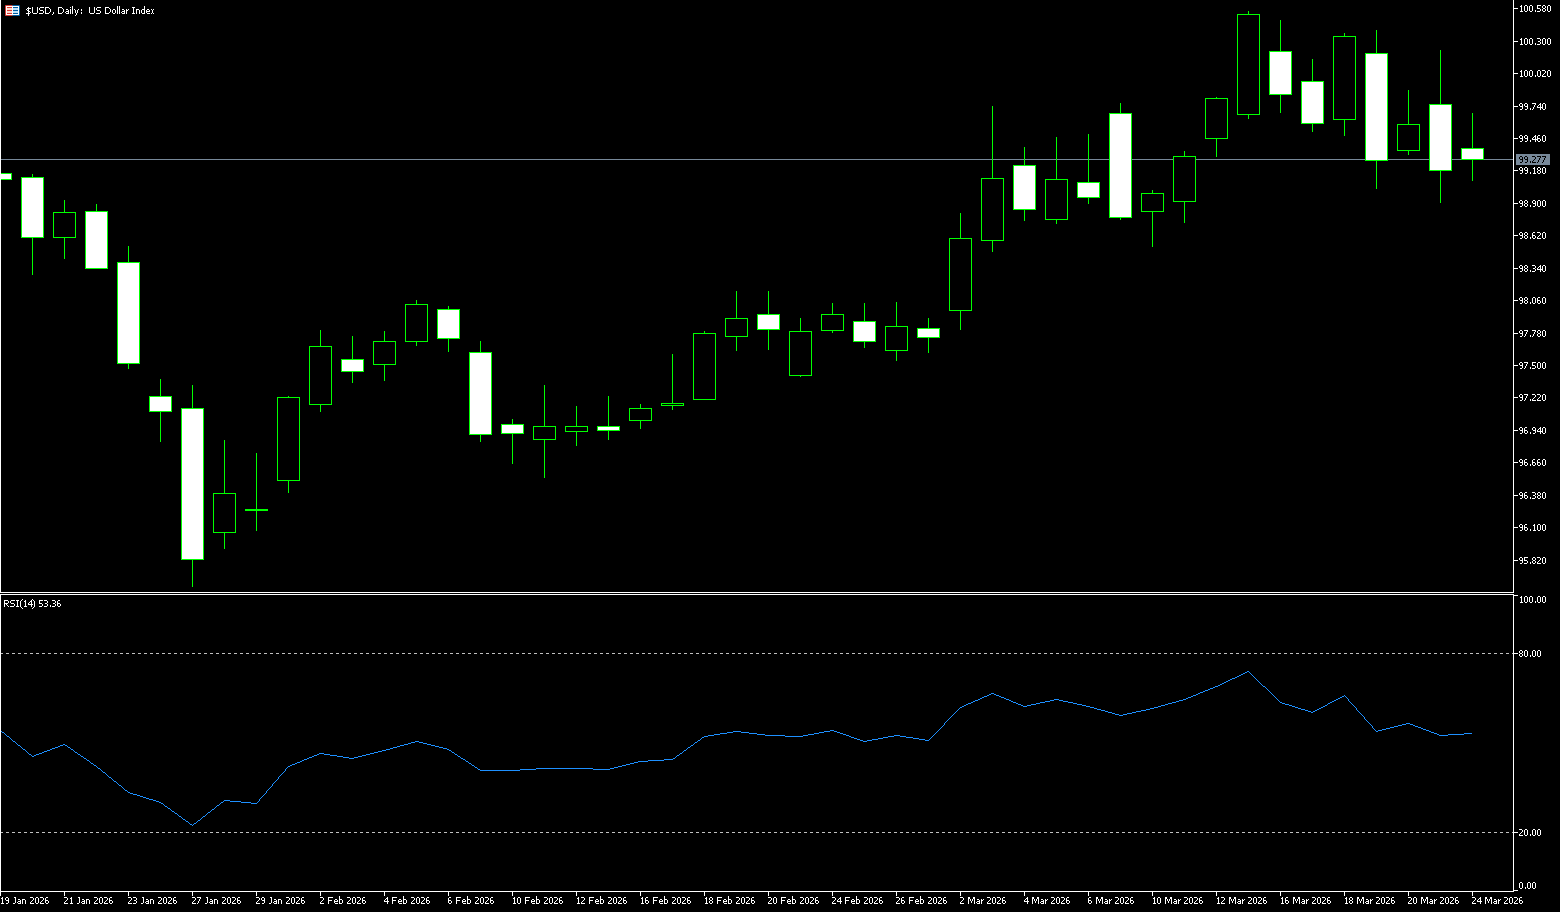
The US dollar index climbed to 99.60 on Tuesday, recovering some of the losses from the previous trading session, as Iran denied any negotiations to end the conflict, refuting President Trump's claims. Tehran also announced new attacks on US targets, while Israel continued its strikes against Iran, maintaining tensions. On Monday, the dollar faced heavy selling pressure five days after Trump postponed planned strikes on Iranian energy infrastructure, despite Trump stating that discussions with Iran were productive. The outcome of any negotiations and the potential reopening of the Strait of Hormuz remain highly uncertain, and Middle Eastern energy capacity may take time to recover to previous levels. This increases the risk of rising inflation in the coming months and the likelihood of interest rate hikes by major central banks. Investors are now turning their attention to upcoming US manufacturing data for new clues about how businesses are performing amid heightened geopolitical risks.
In the short term, as long as there is no substantial easing of geopolitical conflicts in the Middle East, persistently high oil prices will continue to push up inflation stickiness, making it difficult for the Federal Reserve to shift towards easing. Its hawkish stance and the strong dollar are unlikely to reverse in the short term. As one of the top three most influential indices in the market, the US dollar index continues to be favored by the market due to the high yield and high liquidity of the US dollar. Trading requires close monitoring of US Treasury yields. From a medium- to long-term perspective, if geopolitical conflicts continue to escalate and evolve into a global stagflation environment, or if concerns about US debt problems and fiscal sustainability intensify, coupled with a growing narrative of "de-dollarization," the credit and exchange rate of the US dollar will gradually come under pressure and weaken. Therefore, on the upside, continued attention can be paid to the 99.68 (9-day moving average) and the 100.00 (a key support/resistance level). On the downside, watch the 99 level (a psychological level); a break below this level would likely lead to a pullback to the support zone of 98.88 (early weekly low) - 98.39 (200-day simple moving average).
Consider shorting the US Dollar Index today at 99.30, with a stop-loss at 99.40 and targets at 98.80 and 98.90.
WTI Crude Oil
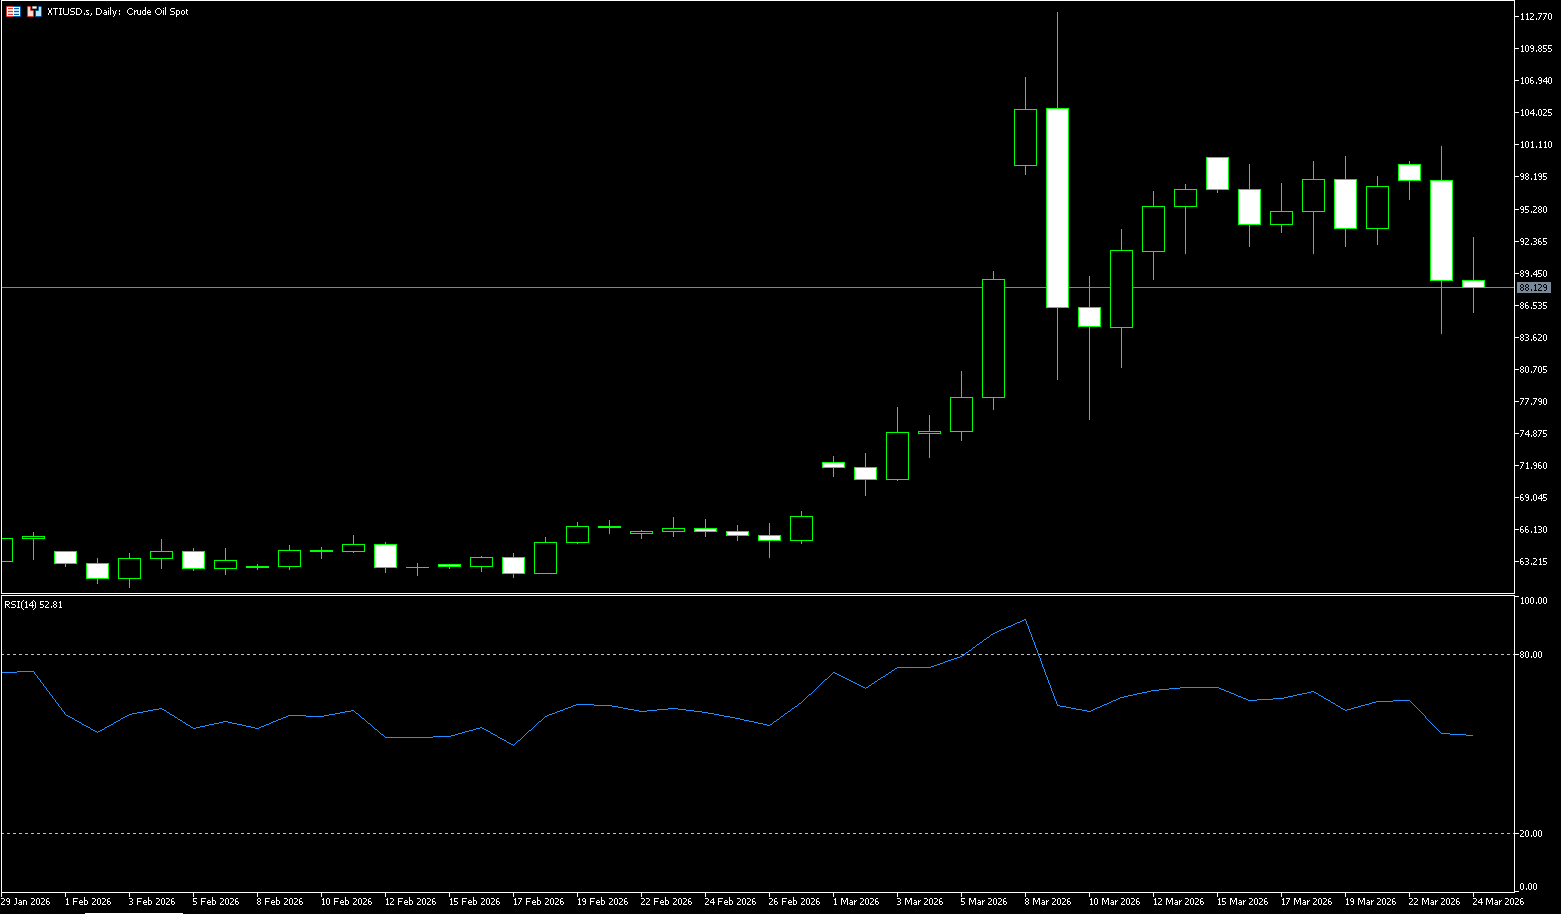
US crude oil is trading around $88 per barrel, after a nearly 11% plunge on Monday. Earlier... Following Trump's announcement of a pause in military operations, market risk appetite quickly improved, temporarily easing investor concerns about disruptions to Middle Eastern energy supplies. This shift directly caused WTI crude oil prices to fall from an intraday high of $101 per barrel to $84 per barrel. The sharp drop in WTI crude oil directly alleviated energy inflation pressures; earlier, oil prices approaching $100 per barrel had sparked discussions among global central banks about extending the pause in interest rate cuts, but the situation has now reversed. The tense exchanges between the US and Iran threatened the energy and infrastructure security of Gulf countries, pushing expectations for rising international oil prices to a temporary peak. However, after opening higher, oil prices began to correct, showing a phenomenon of "profit-taking" and "failure to rise despite positive news." Meanwhile, the primary objective and key observation points of these negotiations are the Strait of Hormuz and global oil prices, and this expectation... Concerns that initially drove oil prices higher quickly subsided. With the opening of the US-Iran negotiation window, supply concerns eased, and the premium was quickly cleared, ultimately leading to a sharp drop in crude oil prices after a high opening.
The implementation of the differentiated air traffic control mechanism with Iran and Trump's postponement of military strikes were two positive factors that directly drove the rapid clearing of geopolitical risk premiums. WTI crude oil prices plummeted by over 10% on Monday, currently trading at $89 per barrel, with market panic significantly easing. The exchange of harsh words between the US and Iran threatened Gulf countries, pushing international oil price expectations to a temporary peak. However, after the initial surge, oil prices began to correct, indicating that the positive news was priced in and failed to drive prices higher. In the short term, the possibility of a temporary peak and correction at the psychological level of $100 cannot be ruled out. Resistance is seen at $94.40 (the 9-day moving average). And the psychological level of $100. In the short term, be wary of a pullback due to risk aversion. If it breaks below the support zone of $84.50 (20-day moving average) and $84.00 (psychological level), it will further target the $80.00 (psychological level).
Today, consider going long on spot crude oil at $87.60, with a stop loss at $87.40 and targets of $90.00 and $91. 00
Spot Gold
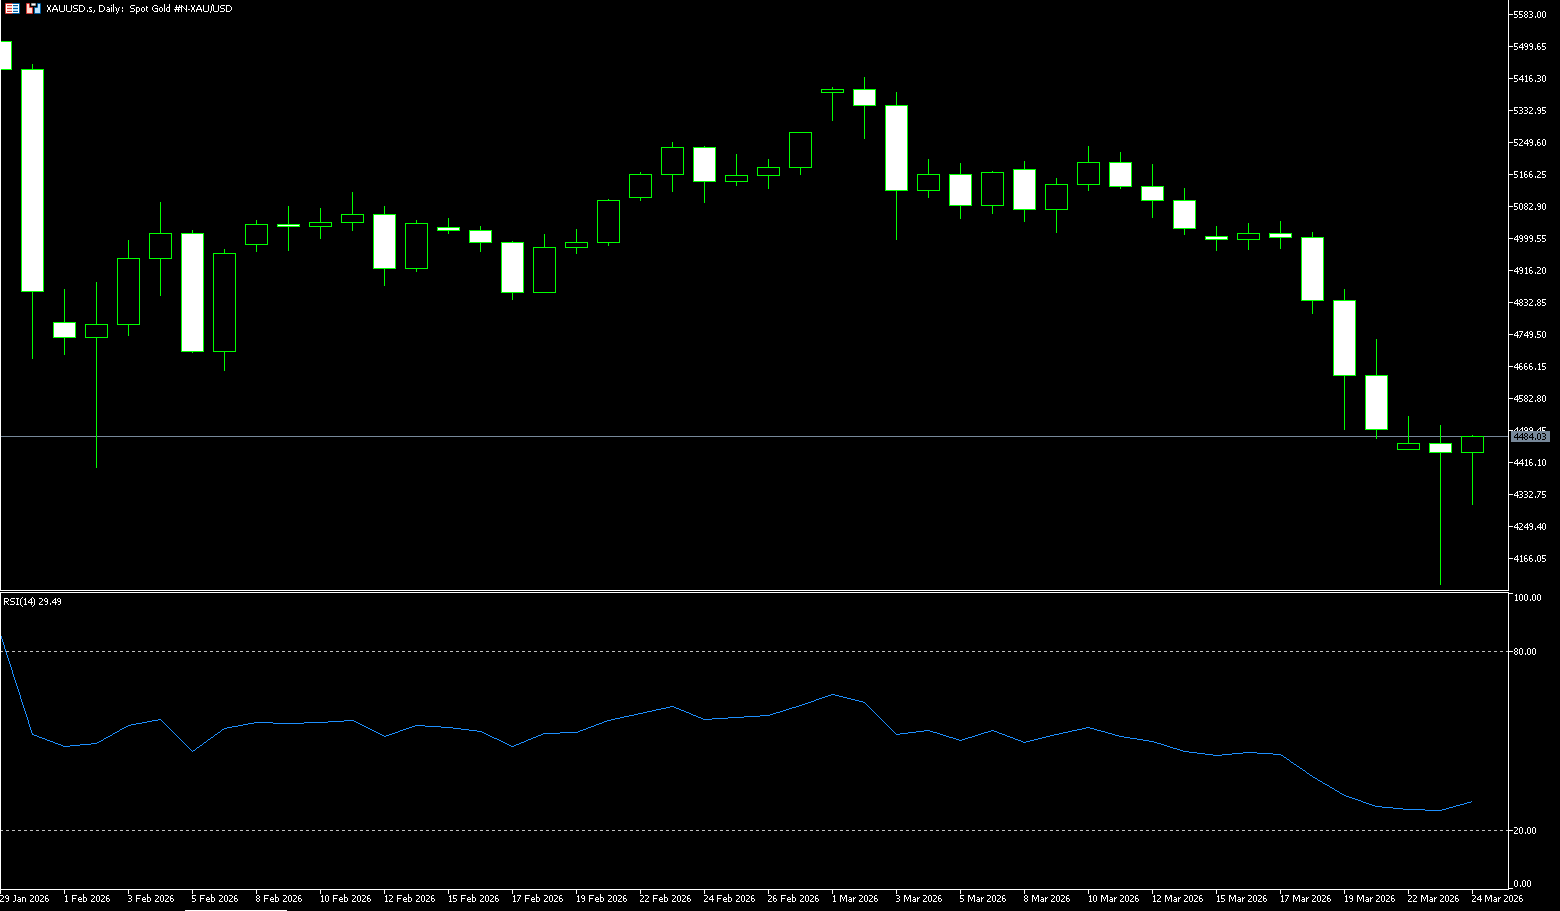
On Tuesday (March 24, Beijing time), spot gold traded around $4,450 per barrel. Gold prices fell below $4,100 per ounce on Monday, marking the ninth consecutive trading day of decline. However, the decline narrowed after Trump announced a five-day delay in the strikes against Iranian power plants and stated that the US was consulting with Tehran on ending the war, pushing gold prices back above $4,400 per ounce. As an inflation hedge, gold's pricing logic has shifted from pure safe-haven appeal to being driven by policy expectations: a drop of about $10 per barrel in oil prices can significantly reduce global energy costs, thereby mitigating the risk of rising core inflation. Spot gold found support under pressure on real yields. This reversal is not simply a result of safe-haven characteristics, but rather a combination of fundamentals and sentiment. The results highlight the sensitivity of precious metals under the interplay of multiple factors. Gold prices show a significant negative correlation with the US dollar. Following Trump's announcement, the safe-haven premium for the US dollar declined, directly benefiting gold, a non-interest-bearing asset. Recently, the US dollar index strengthened due to oil price volatility and geopolitical risks, which had previously suppressed gold prices, but the current stable and slightly declining trend provides upward momentum for gold.
From a fundamental perspective, if progress is made in the dialogue during Trump's five-day pause, reduced uncertainty in energy supply will continue to suppress oil prices and support gold's inflation hedging properties. The global trend of central bank gold reserve diversification remains unchanged, coupled with the potential return of ETF holdings, forming medium- to long-term support. Technically, gold prices rebounded in a "V" shape from the low of $4,100/ounce and are currently facing the psychological barrier of $4,500. The price is facing resistance near the 4,550 area (lower Bollinger Band on the daily chart). A break above this level would test the week's high of $4,736. Increased volatility reflects event sensitivity, with traders watching synchronized indicators for oil prices and the US dollar to confirm the sustainability of the trend. Overall, the market's panic selling sentiment reached its peak due to the extreme price action at the beginning of the week, which saw a brief surge followed by a sharp drop. Therefore, watch the 4,300.00 psychological level and the 4,283.30 area (160-day moving average). A break below these levels could lead to a return to the 4,098 level (early week low) and the 4,096 level (2000-day moving average).
Today, consider going long on spot gold at 4,465, with a stop loss at 4,455 and a target of 4,530. 4,550
AUD/USD
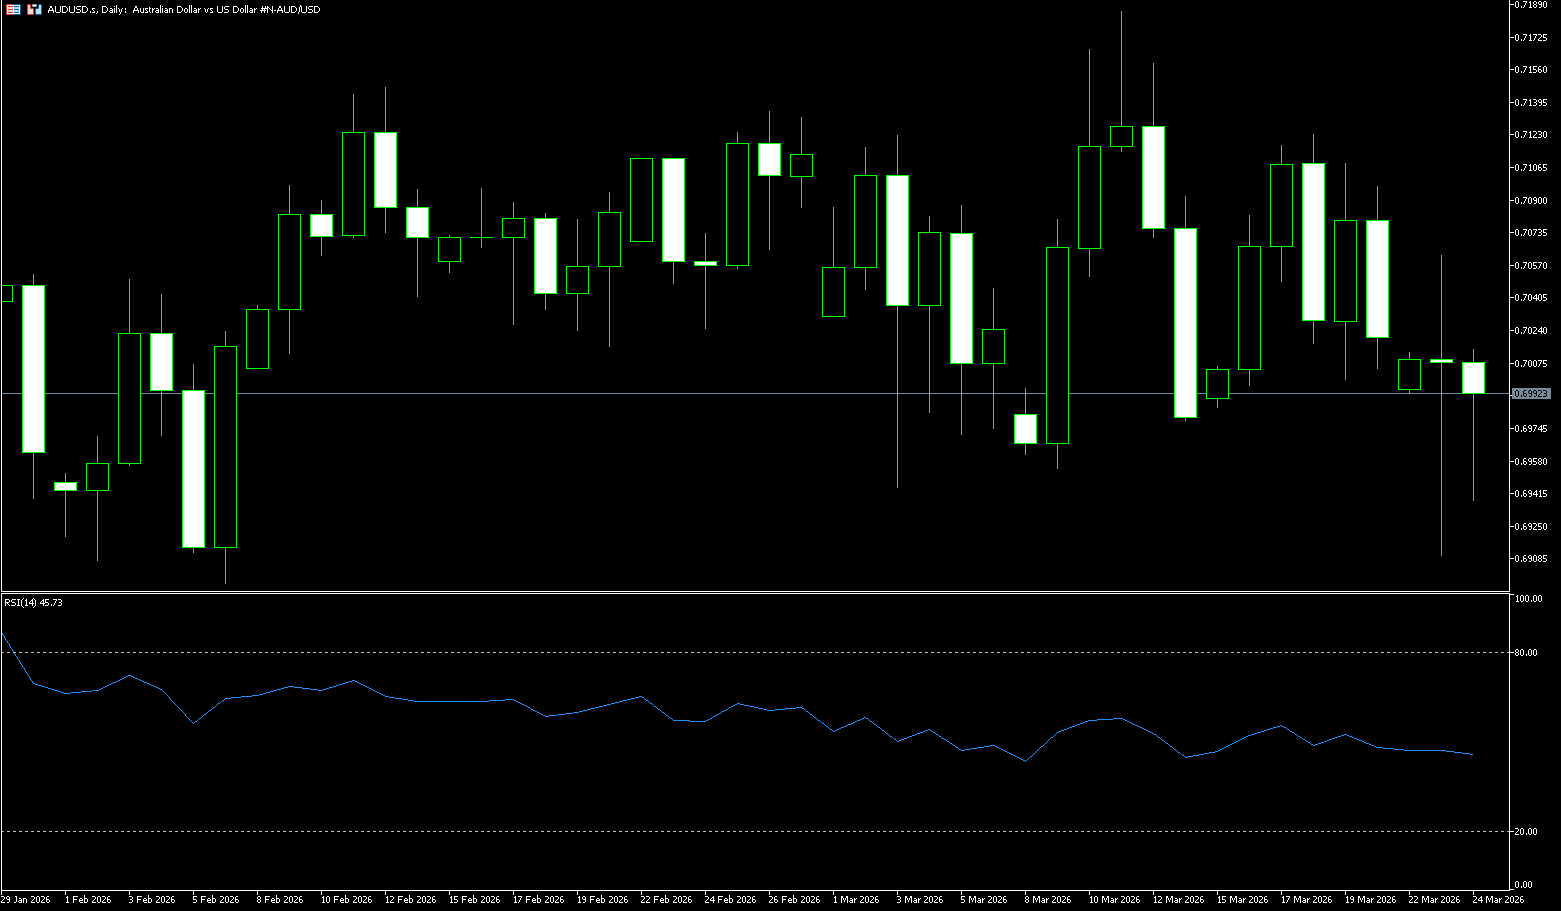
The Australian dollar weakened broadly against the US dollar, approaching 0.6990. Risk aversion resurfaced as Iran stated it was not involved in any peace talks with the US, contradicting comments from US President Trump. On Monday, President Trump announced he had instructed the War Department to suspend military attacks on Iranian power plants for five days, citing “very good and productive dialogue” with Tehran aimed at a complete resolution of our hostilities in the Middle East. The renewed risk aversion supported the US dollar, which fell significantly following President Trump's remarks. In addition to deteriorating market sentiment, weak preliminary readings of Australia's March S&P Global Purchasing Managers' Index (PMI) also weighed on the Australian dollar. Meanwhile, investors awaited the release of Australia's February Consumer Price Index on Wednesday. CPI data.
Currently, the short-term outlook for the Australian dollar remains positive, thanks to persistently high inflation and the Reserve Bank of Australia's hawkish stance. This backdrop could support further upside for the AUD/USD pair while also providing some buffer against cyclical pullbacks. On the daily chart, the AUD/USD pair is trading at 0.6980. The short-term bias is slightly bearish, as the pair has broken below the 23.6% Fibonacci retracement level of 0.6976, calculated from the low of 0.6421 to the high of 0.7147, indicating weakening upward momentum from recent highs. The 14-day Relative Strength Index (RSI) has fallen to 44, confirming weakening bullish pressure. Initial resistance is now at the psychological level of 0.7000; a break above this level would open the way to the 20-day moving average (0.7063). Immediate support is seen at the psychological level of 0.6900. The next level to watch is 0.6834 (the low of January 23rd).
Consider going long on the Australian dollar today at 0.6988, with a stop-loss at 0.6975 and a target of 0.7060. 0.7050
GBP/USD
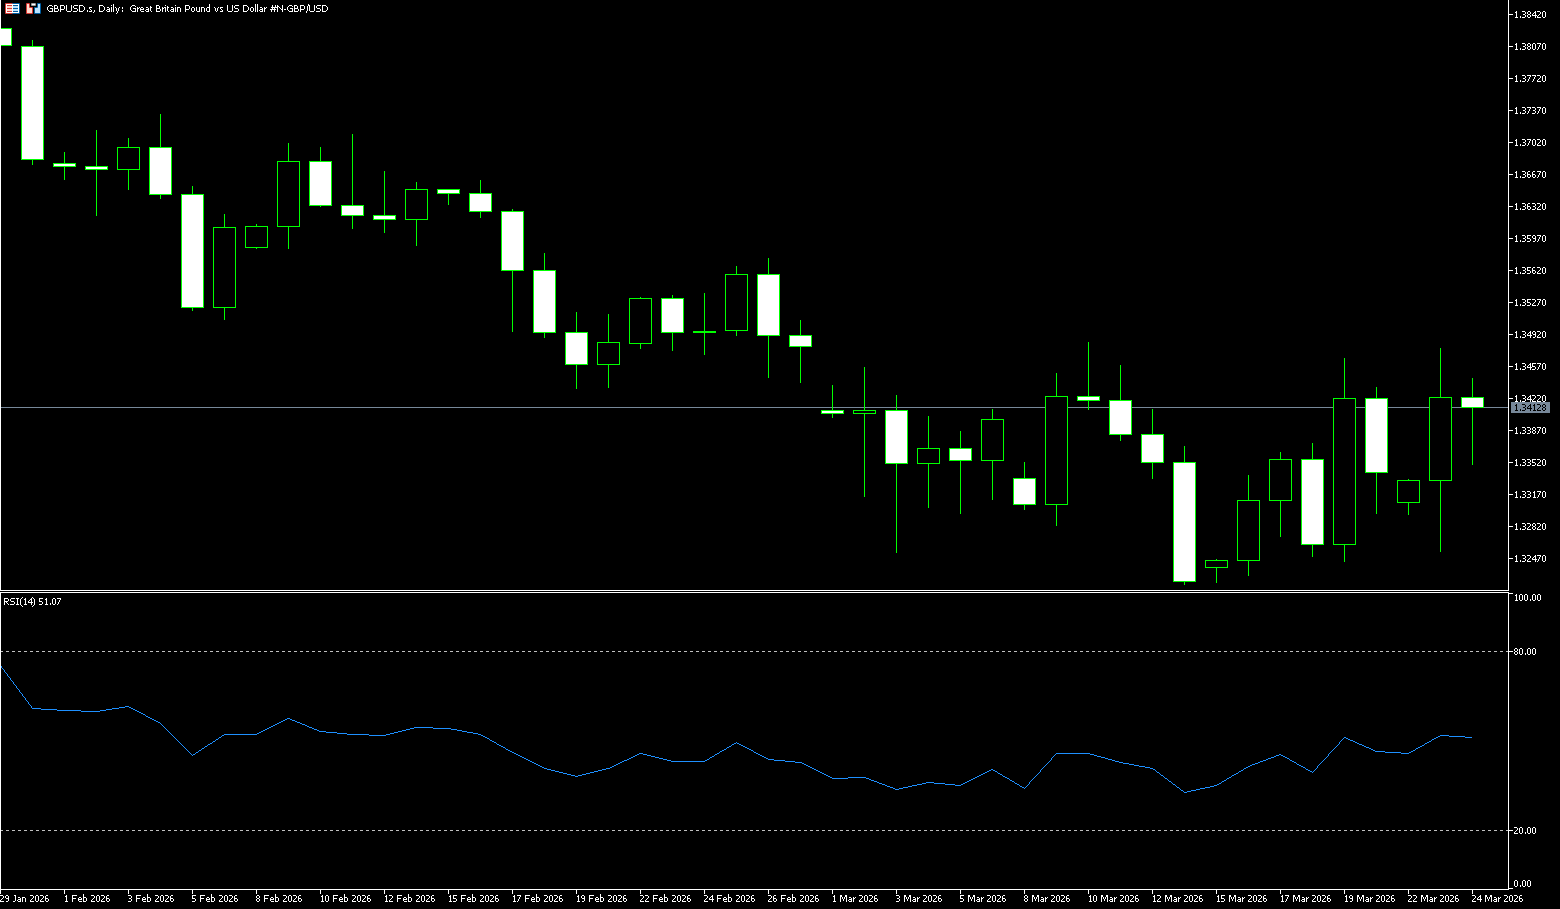
GBP/USD came under pressure after a slight gain the previous day, trading near 1.3400 in Asian trading on Tuesday. Risk-sensitive currency pairs weakened amid rising risk aversion as US-backed Gulf states moved closer to direct intervention in the Iranian conflict and Saudi Arabia signaled a potential military shift. Israel launched its latest attack on Iran despite US President Donald Trump's statement that it would suspend strikes on energy infrastructure following productive talks with Tehran. However, Iranian Foreign Minister Abbas Araghchi denied any contact with Washington. The Bank of England kept interest rates at 3.75% at its March meeting, as widely expected. Bank of England Governor Andrew Bailey stated that the Middle East conflict would have a "shock" to the economy and push up inflation in the short term, adding that restoring safe shipping through the Strait of Hormuz was a response to energy price fluctuations. The key to a rebound.
The daily chart shows GBP/USD at 1.3328. The short-term bias is mildly bearish, as the spot price is below the 50-day, 100-day, and 200-day simple moving averages, which are clustered in the 1.34-1.35 range, and the relatively flat 100-day and 200-day moving averages near 1.34 limit any immediate rebound. This pattern suggests weakening upward momentum within a broader consolidation context, with the Relative Strength Index (RSI) falling to 48, reinforcing the downward bias on the daily chart. Near-term resistance lies in the 1.3433 {200-day simple moving average} to 1.3480 {Monday's high} range. A break above this range could trigger an extended rally towards 1.3500 (psychological level). Initial support is seen at 1.3344 (9-day simple moving average), a break below which would expose lower sideways support such as 1.3300 (psychological level).
Consider going long GBP at 1.3405 today. Stop Loss: 1.3390; Target: 1.3480; 1.3460
USD/JPY
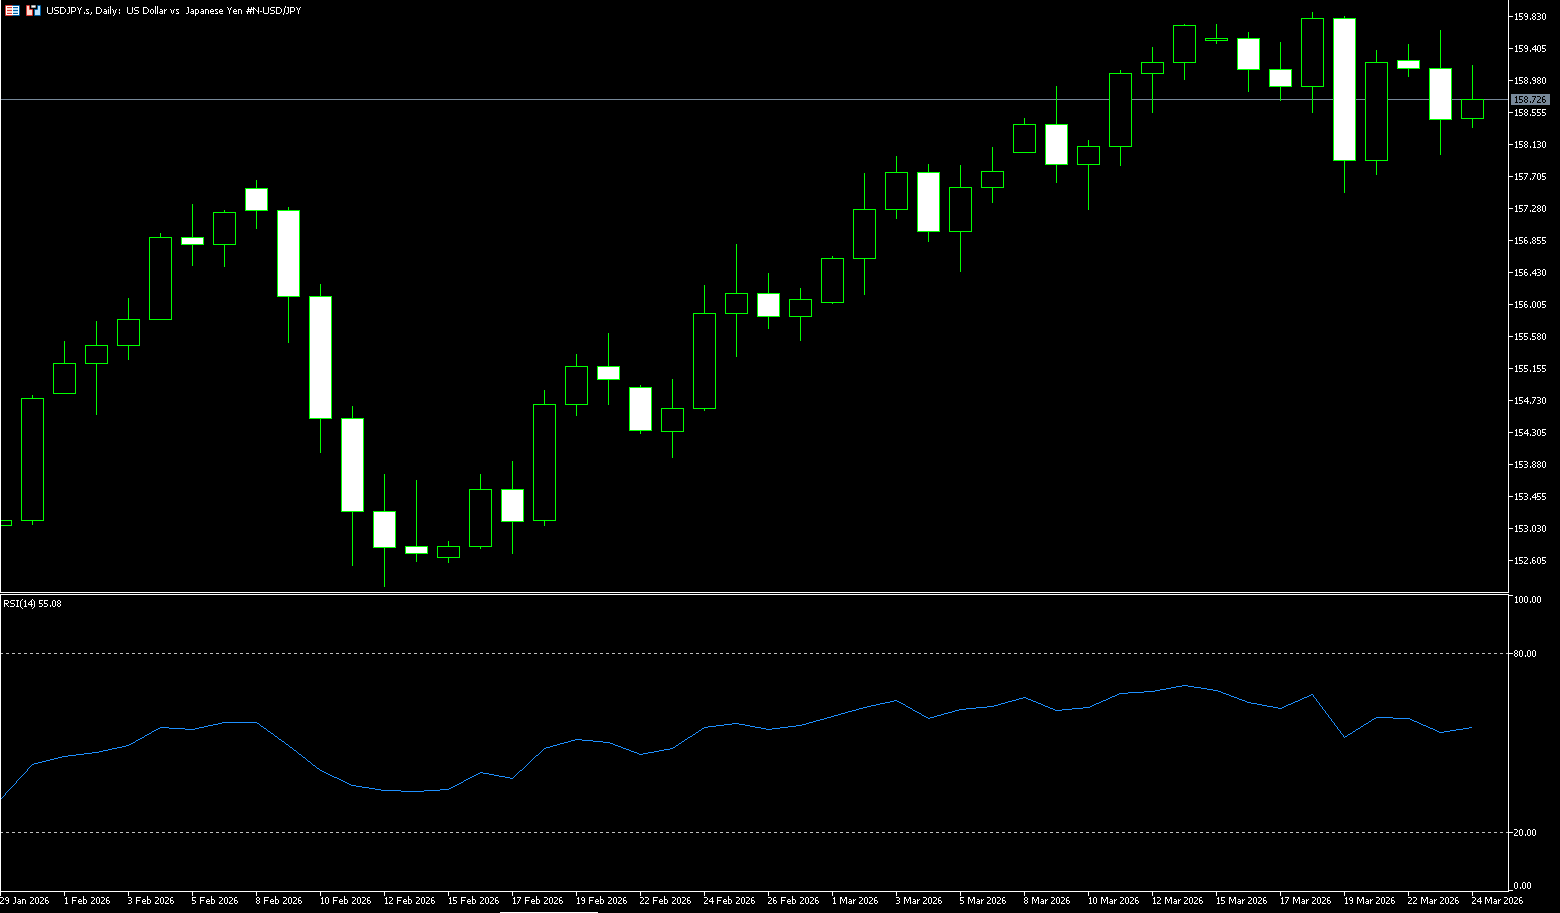
USD/JPY remained in positive territory around 158.60 during Tuesday's Asian morning session. The yen weakened against the dollar due to a lower-than-expected inflation report. Data released by Japan's Statistics Bureau on Tuesday showed that the national consumer price index (CPI) rose 1.3% year-on-year in February, down from 1.5% previously. This is the lowest level since March 2022 and below the Bank of Japan's 2% target. Traders will be closely watching the situation in the Middle East. Any escalation of tensions or signs of continued conflict could exacerbate concerns about rising inflation and energy prices, thus supporting USD/JPY in the short term. US President Trump offered Iran a five-day grace period, saying he believed new talks with Tehran could lead to an agreement to resolve the conflict. However, Iranian officials denied any negotiations with the US after Trump's statement. Mohsen Rezaei, a senior military advisor to Iran's Supreme Leader Khamenei... The statement indicated that the war would continue until Iran received full compensation for its losses.
The 160 level for the USD/JPY exchange rate has once again become a psychological barrier that the market struggles to overcome. Currently, the exchange rate is hovering around 158.50, with the market generally unwilling to risk testing the Japanese Finance Minister's clear warning of "decisive measures and direct intervention." This has led investors to hesitate to test the upper limit. The continued weakness of the yen has been seen by the Japanese government and central bank as a major cause of imported cost-push inflation. This signal may limit further appreciation of the dollar and prompt this month's gains to enter a correction phase. Although the dollar is supported by the USD/JPY interest rate differential, the upside potential above 160 has been significantly compressed. In the short term, the cumulative gains this month may face profit-taking pressure, with the correction target potentially pointing to the 157.50 (25-day moving average) - 157 (psychological level) range. If actual Japanese intervention occurs, the correction may widen further; conversely, if the dollar index continues to hold above 100, the yen's rebound momentum will end. There is a chance to retest the 160 (psychological level) and the 160.30 (upper Bollinger Band) area.
Consider shorting the US dollar at 158.85 today, with a stop loss at 159.00 and a target of 158.00. 157.80
EUR/USD
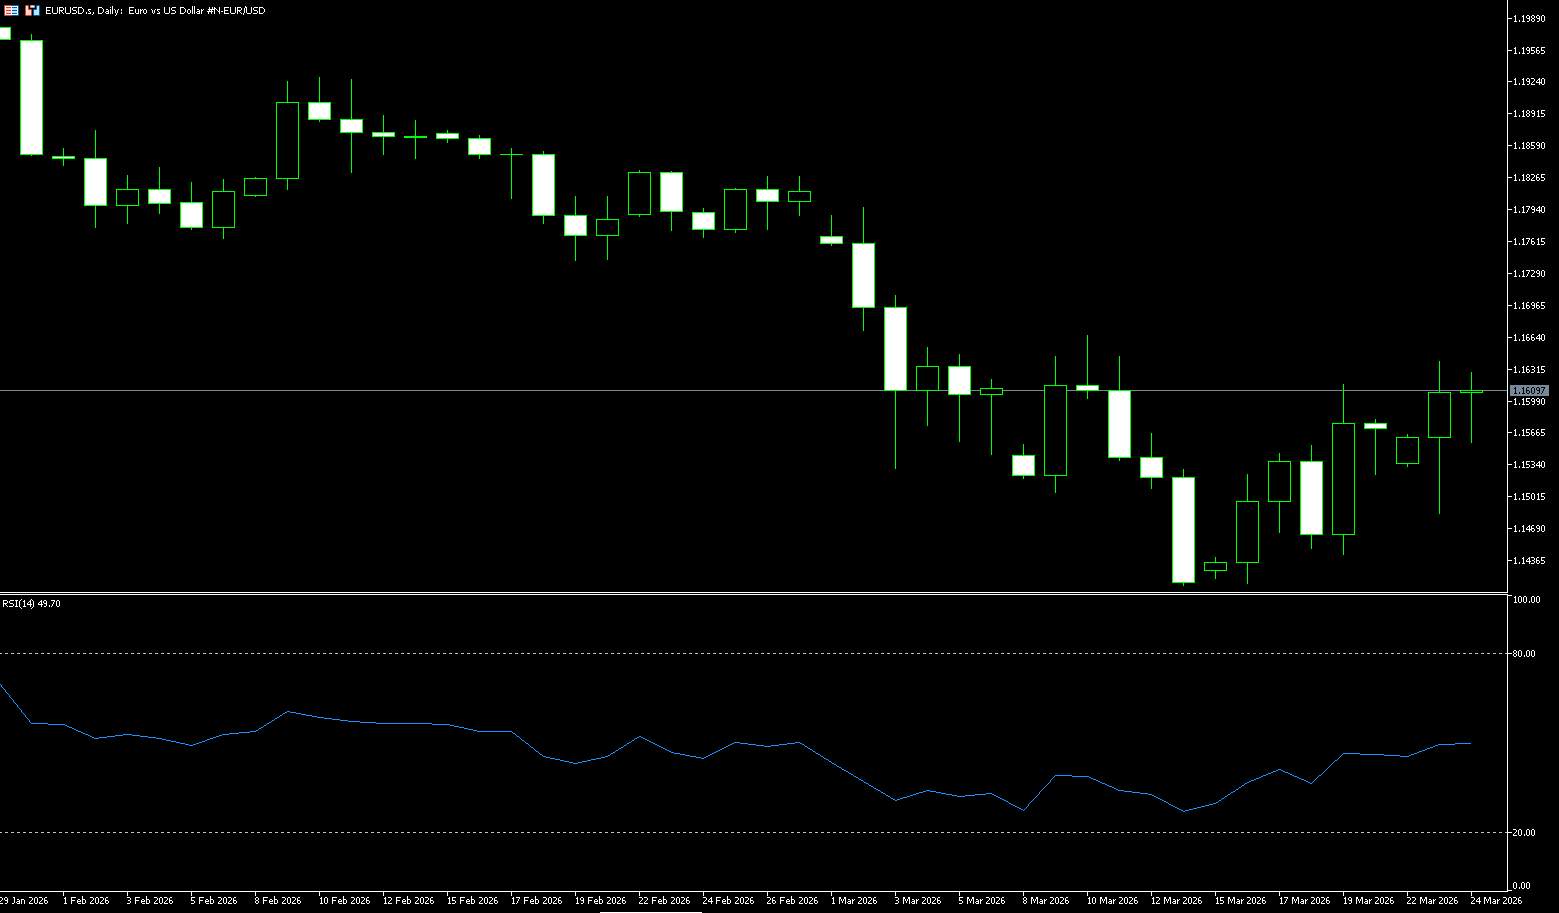
The euro/dollar pair lost some of its gains after a slight rise in the previous session, trading around 1.1600 on Tuesday. The pair weakened as risk aversion increased and the dollar strengthened amid escalating conflict in the Middle East. Reports on Tuesday indicated that the Israeli military had launched a new round of attacks on Tehran. This followed US President Trump's statement that attacks on energy infrastructure would be suspended after productive talks with Iran. Iranian Foreign Minister Abbas Araqchi stated that there was "no dialogue" between Tehran and Washington. Meanwhile, Iranian Parliament Speaker Mohammad Bagher Ghalibaf stated on social media on Monday that "there have been no negotiations with the United States." Mohsen Rezaei, a senior military advisor to Iran's Supreme Leader Khamenei, stated that the war would continue until Iran receives full compensation for its losses. Rising oil prices exacerbated inflation concerns, reinforcing the European Central Bank's hawkish stance. Policymakers are scheduled to speak, and any hawkish signals could provide support for the euro.
On the daily chart, EUR/USD is trading slightly above 1.16. The near-term bias is slightly bearish, as the spot price is below the descending trendline drawn from 1.2086, while also being capped by the converging simple moving average around 1.1730, which now acts as resistance. The latest Relative Strength Index (RSI) reading is near 46, and the rebound from the recent oversold zone below 30 remains below the 50 midline, suggesting some easing of bearish pressure, but upward momentum has not yet been established. Initial resistance is at 1.1680 (30-day simple moving average), followed by 1.1700 (psychological level). Near-term support is seen at 1.1530 (9-day simple moving average), followed by 1.1500 (psychological level); a break below these levels would restart the downtrend and expose further weakness.
Consider going long on the Euro today at 1.1595, with a stop-loss at 1.1580 and targets at 1.1650 and 1.1660.
Disclaimer: The information contained herein (1) is proprietary to BCR and/or its content providers; (2) may not be copied or distributed; (3) is not warranted to be accurate, complete or timely; and, (4) does not constitute advice or a recommendation by BCR or its content providers in respect of the investment in financial instruments. Neither BCR or its content providers are responsible for any damages or losses arising from any use of this information. Past performance is no guarantee of future results.
Lebih Liputan


Pendedahan Risiko:Instrumen derivatif diniagakan di luar bursa dengan margin, yang bermakna ia membawa tahap risiko yang tinggi dan terdapat kemungkinan anda boleh kehilangan seluruh pelaburan anda. Produk-produk ini tidak sesuai untuk semua pelabur. Pastikan anda memahami sepenuhnya risiko dan pertimbangkan dengan teliti keadaan kewangan dan pengalaman dagangan anda sebelum berdagang. Cari nasihat kewangan bebas jika perlu sebelum membuka akaun dengan BCR.
BCR Co Pty Ltd (No. Syarikat 1975046) ialah syarikat yang diperbadankan di bawah undang-undang British Virgin Islands, dengan pejabat berdaftar di Trident Chambers, Wickham’s Cay 1, Road Town, Tortola, British Virgin Islands, dan dilesenkan serta dikawal selia oleh Suruhanjaya Perkhidmatan Kewangan British Virgin Islands di bawah Lesen No. SIBA/L/19/1122.
Open Bridge Limited (No. Syarikat 16701394) ialah syarikat yang diperbadankan di bawah Akta Syarikat 2006 dan berdaftar di England dan Wales, dengan alamat berdaftar di Kemp House, 160 City Road, London, City Road, London, England, EC1V 2NX. Entiti ini bertindak semata-mata sebagai pemproses pembayaran dan tidak menyediakan sebarang perkhidmatan perdagangan atau pelaburan.

 English
 简体中文
简体中文
 繁體中文
繁體中文
 Bahasa
Melayu
Bahasa
Melayu
 Tiếng
Việt
Tiếng
Việt
 ไทย
ไทย
 日本語
日本語
 한국어
한국어
 ភាសាខ្មែរ
 español

