


0
US Dollar Index
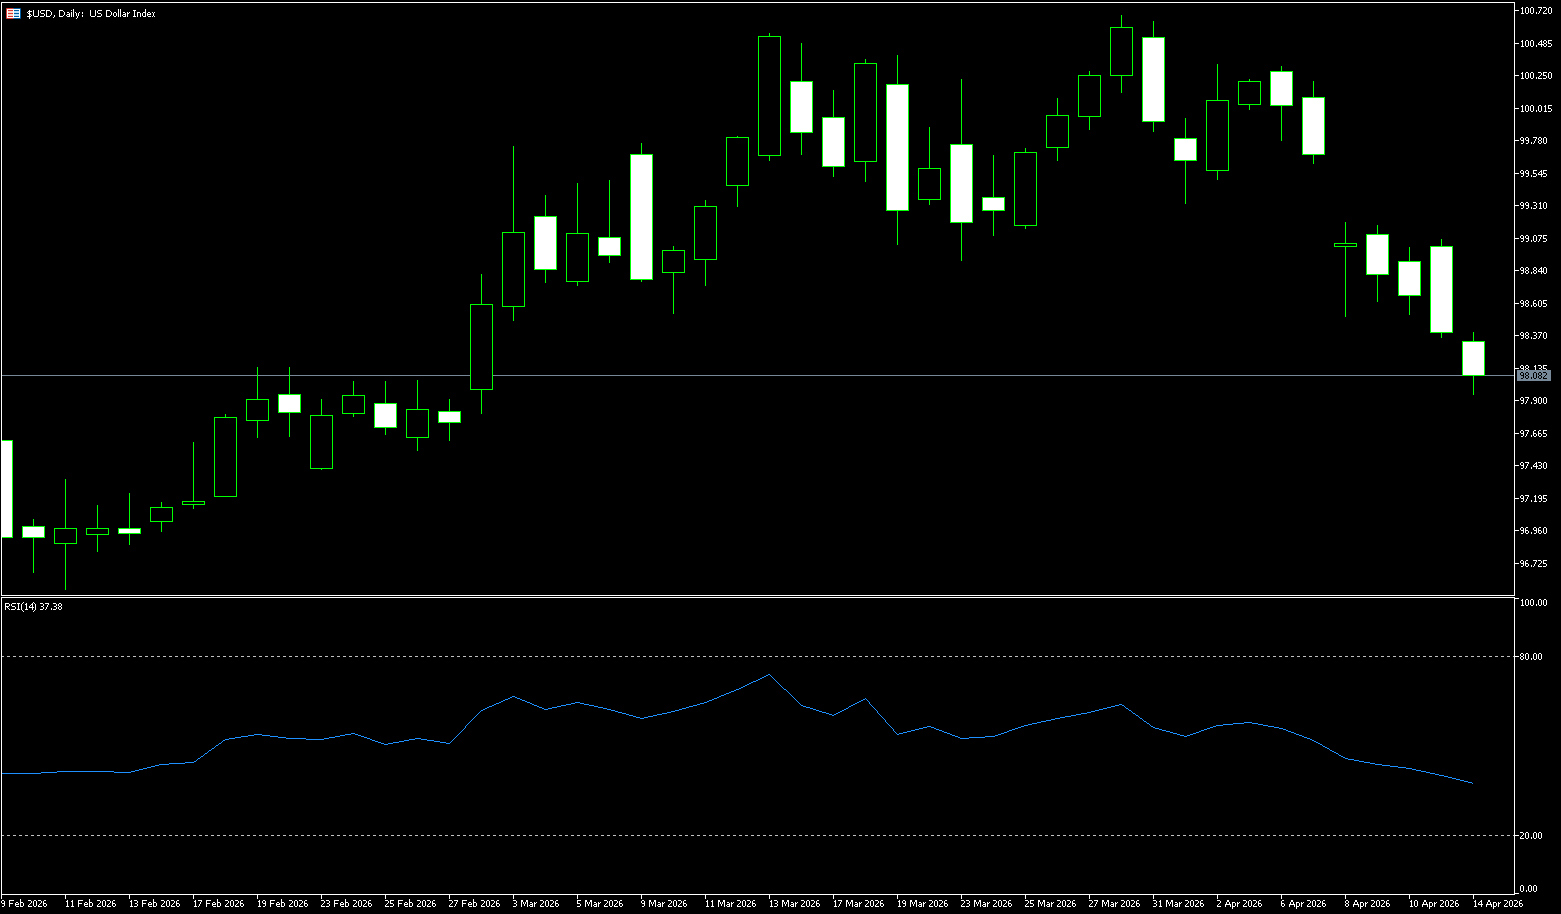
The US dollar index retreated from its early highs on Monday, marking its sixth consecutive day of decline, as the US military began blockading ships leaving Iranian ports after the breakdown of US-Iran peace talks, and Tehran threatened retaliation against its Gulf neighbors' ports. The dollar index fell to 98.08. The euro rose 0.15% against the dollar to $1.1737, while risk-sensitive currencies such as the Australian and New Zealand dollars strengthened. A roughly 40% rise in oil prices exacerbated stagflation concerns, but the dollar, as a safe-haven currency and relatively unaffected by imported energy inflation, typically strengthens during periods of geopolitical tension. On the other hand, the latest discussions with US Vice President Vance were productive, with US officials gaining valuable insights into the negotiation process with Iran. The outcome was not a failure, noting that Iran showed signs of moving closer to the US position, although not enough to reach a final agreement. A comprehensive agreement framework is achievable if Iran is willing to take the next step. These comments boosted hopes for diplomacy with Iran and continued to support positive risk sentiment, keeping the dollar near its lowest levels since early March, having touched that level earlier on Tuesday {98.36}.
The dollar had a poor week, with the dollar index falling below the key 200-day simple moving average (98.53), reaching a near-month low of 98.08. The dollar's strong pullback roughly followed a similar decline in US Treasury yields, particularly short- and medium-term yields, reflecting the volatile nature of news surrounding geopolitical developments. With the 14-day Relative Strength Index (RSI) in negative territory at 40, the next targets are the 98.00 psychological level and the 97.77 area (the March 2nd low). On the upside, resistance is concentrated around the 200-day simple moving average at 98.53 and the 98.85 area (the 45-day simple moving average).
Today, consider shorting the US Dollar Index at 98.23, with a stop-loss at 98.35 and targets of 97.70 and 97.60.
WTI Crude Oil
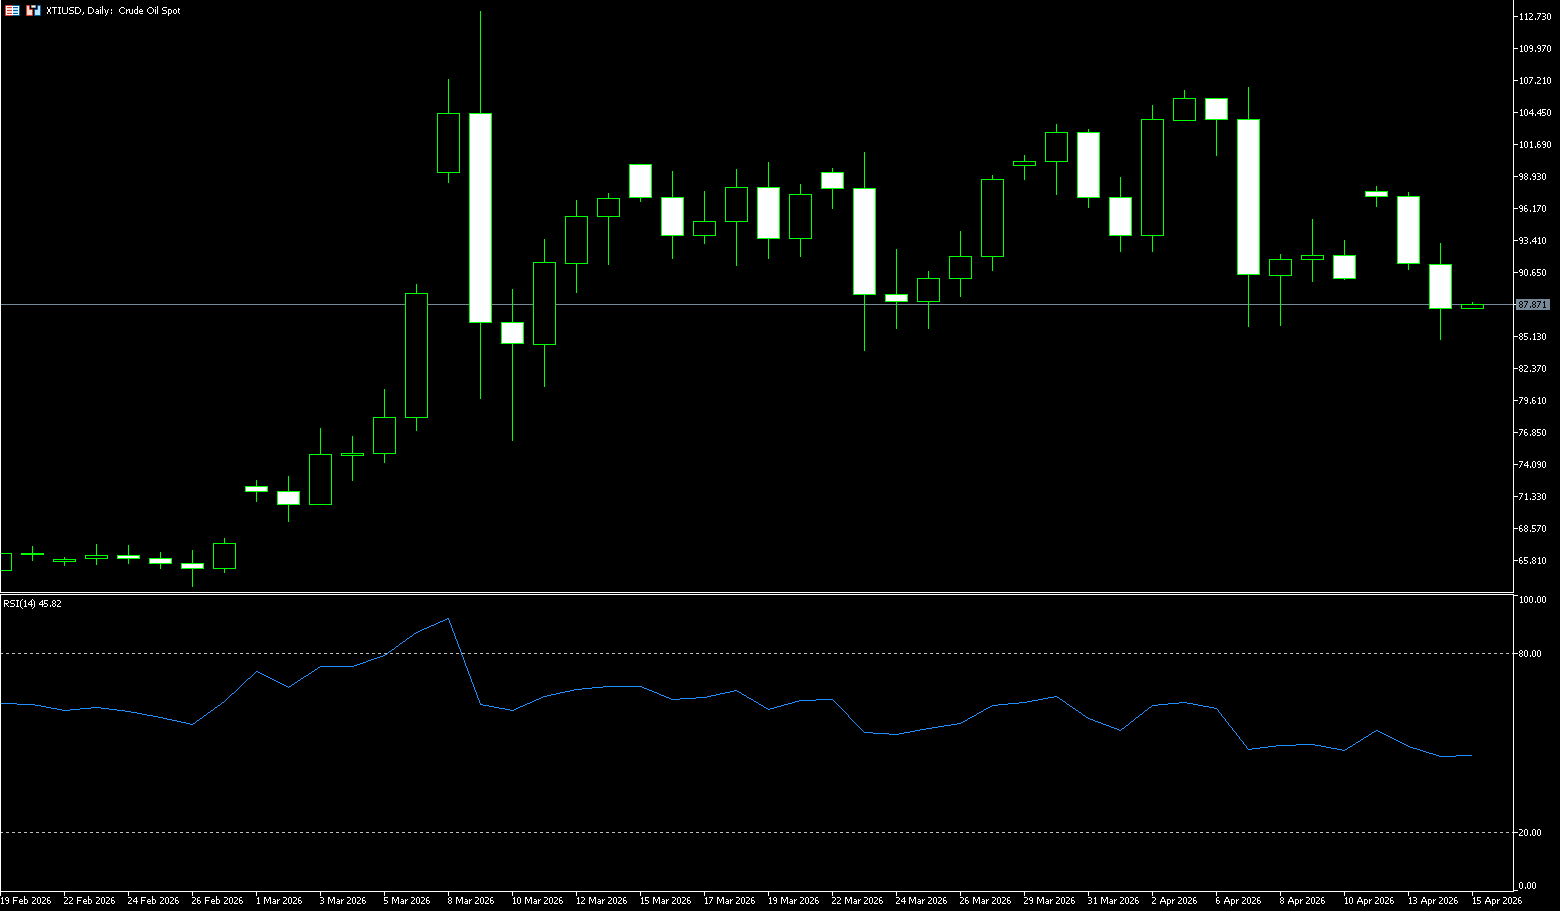
WTI crude oil futures continued their decline, falling more than 3.8% on Tuesday, breaking below $90 a barrel to reach their lowest level in nearly three weeks, as reports that US-Iran negotiations might resume soon boosted optimism about a full reopening of the Strait of Hormuz. Negotiators plan to hold further discussions before the ceasefire expires next week. US President Trump stated that negotiations could restart in Pakistan "within the next two days," while Tehran is reportedly considering temporarily suspending shipments through the Strait of Hormuz to facilitate progress towards an agreement. Meanwhile, President Trump has initiated a US naval blockade of the strait against Iranian oil exports. The International Energy Agency warned that the ongoing conflict could wipe out global oil demand growth this year, leading to the first annual decline since the pandemic. The agency also warned that current prices may not yet fully reflect the scale of the disruption.
WTI crude oil prices tend to fluctuate within a range, adapting to constantly changing conditions; reactions to headlines may be dramatic, but their sustainability is often limited. As a result, traders no longer face a market clearly dominated by one side, but a complex environment where advantages are fragmented and constantly shifting. In such a market, maintaining flexible and strict risk management, and paying close attention to geopolitical dynamics, will be more crucial than simply chasing directional trends. Technically, WTI crude oil is currently trading within a wide and volatile range, exhibiting a clear balanced structure rather than a distinct unidirectional trend. Value zones overlap, with prices primarily oscillating within a range, constantly being repriced based on changes in geopolitical risks. In this environment, breaking through key price levels often requires sufficiently strong confirmation signals, and subsequent momentum is typically weak. On the upside, watch the $93.50 level and the $95.25 area (20-day moving average); on the downside, consider the $85.55 (40-day moving average) and the $88.33 level (Tuesday's low).
Today, consider going long on crude oil at 89.00, with a stop-loss at 88.80 and targets at 91.00 and 91.30.
Spot Gold
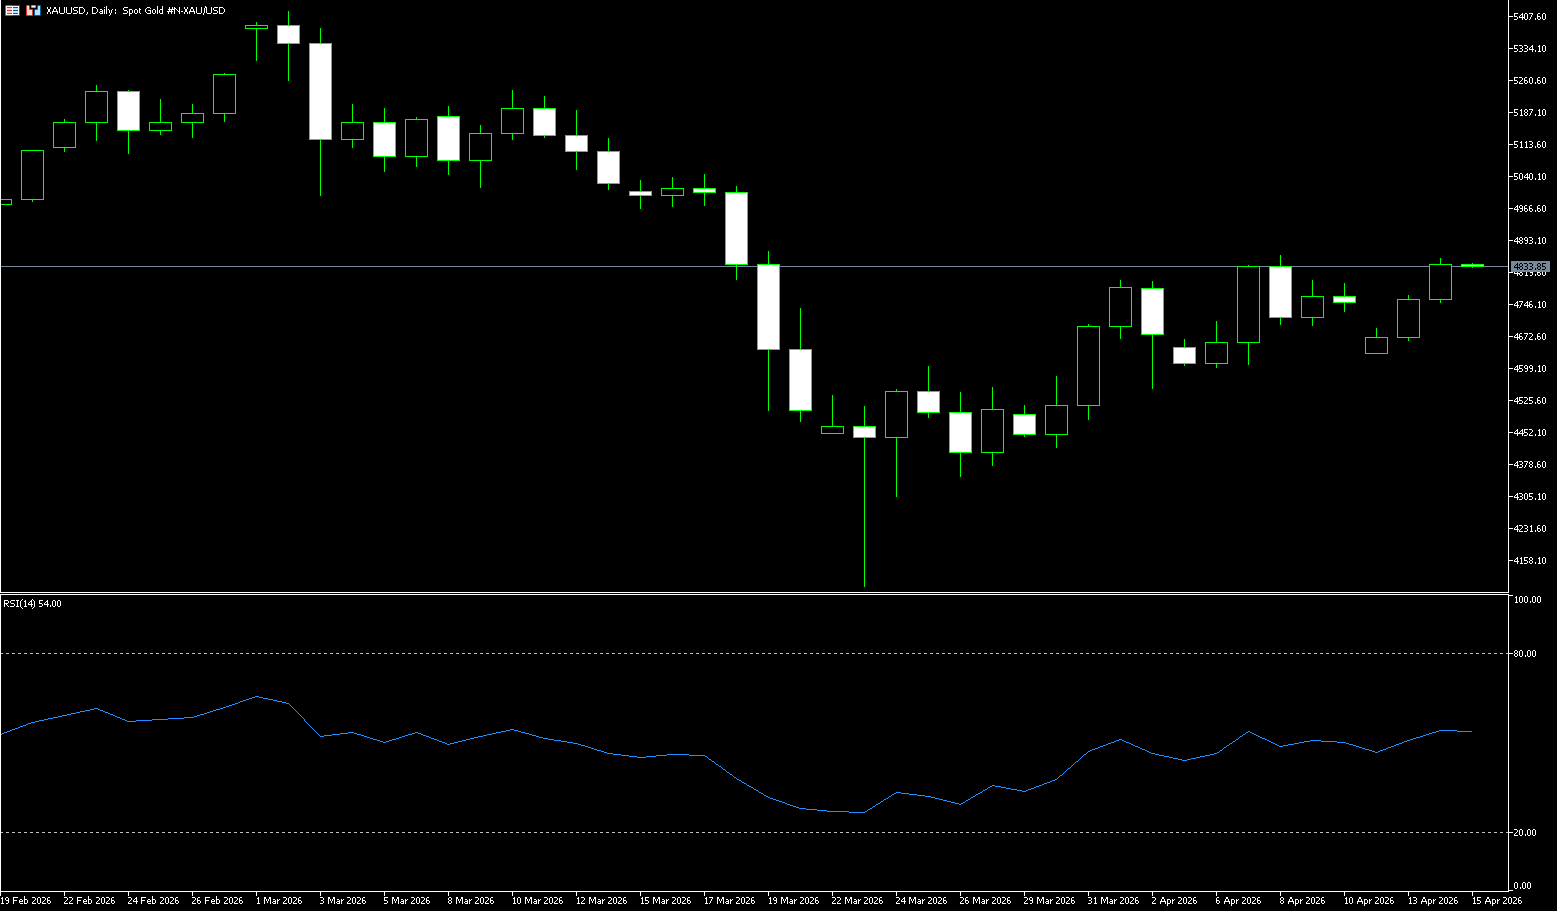
Gold rose to $4,846 an ounce on Tuesday, its highest level since March 18, as progress in US-Iran talks put pressure on the dollar and pushed oil prices below $100 a barrel, easing inflation concerns. Despite the weekend's failed negotiations and the enactment of the Strait of Hormuz blockade, US officials indicated plans for further talks before the two-week ceasefire ends. The dollar fell to a one-month low, and oil prices retreated on hopes for a long-term agreement, reducing concerns about persistent inflation and interest rate hikes. The market now estimates a near 30% chance of a Fed rate cut this year. Despite the rebound, gold remains about 10% lower than pre-conflict levels.
From a technical perspective, the daily chart for spot gold shows that the current price is above the 100-day moving average (approximately $4,694.50) and well above the 200-day moving average (approximately $4,193), but still below the 50-day moving average (approximately $4,902). The 50-day moving average is a key indicator reflecting recent gold price trends, and the current price is under pressure from below it, suggesting that the short-term market remains weak, exhibiting an overall neutral-to-weak range-bound consolidation pattern. Momentum indicators also lack a clear direction: the 14-day RSI is currently around 50.36, close to a neutral level, neither in overbought nor oversold territory, indicating a stalemate between bulls and bears and insufficient buyer confidence; the MACD indicator shows that the current market lacks a clear trend and is in a typical consolidation phase, indicating that bearish momentum has a slight advantage. Key signals to watch for the future: If the price successfully holds above the 50-day moving average, the short-term bullish momentum will strengthen, with the next resistance level pointing to the $5,000-$5,200 range near the previous high. Conversely, if the price breaks below the 100-day moving average support, the first support level to test is the $4,600-$4,500 range.
Consider going long on spot gold today at 4,840, with a stop loss at 4,855 and targets at 4,900 and 4,920.
AUD/USD
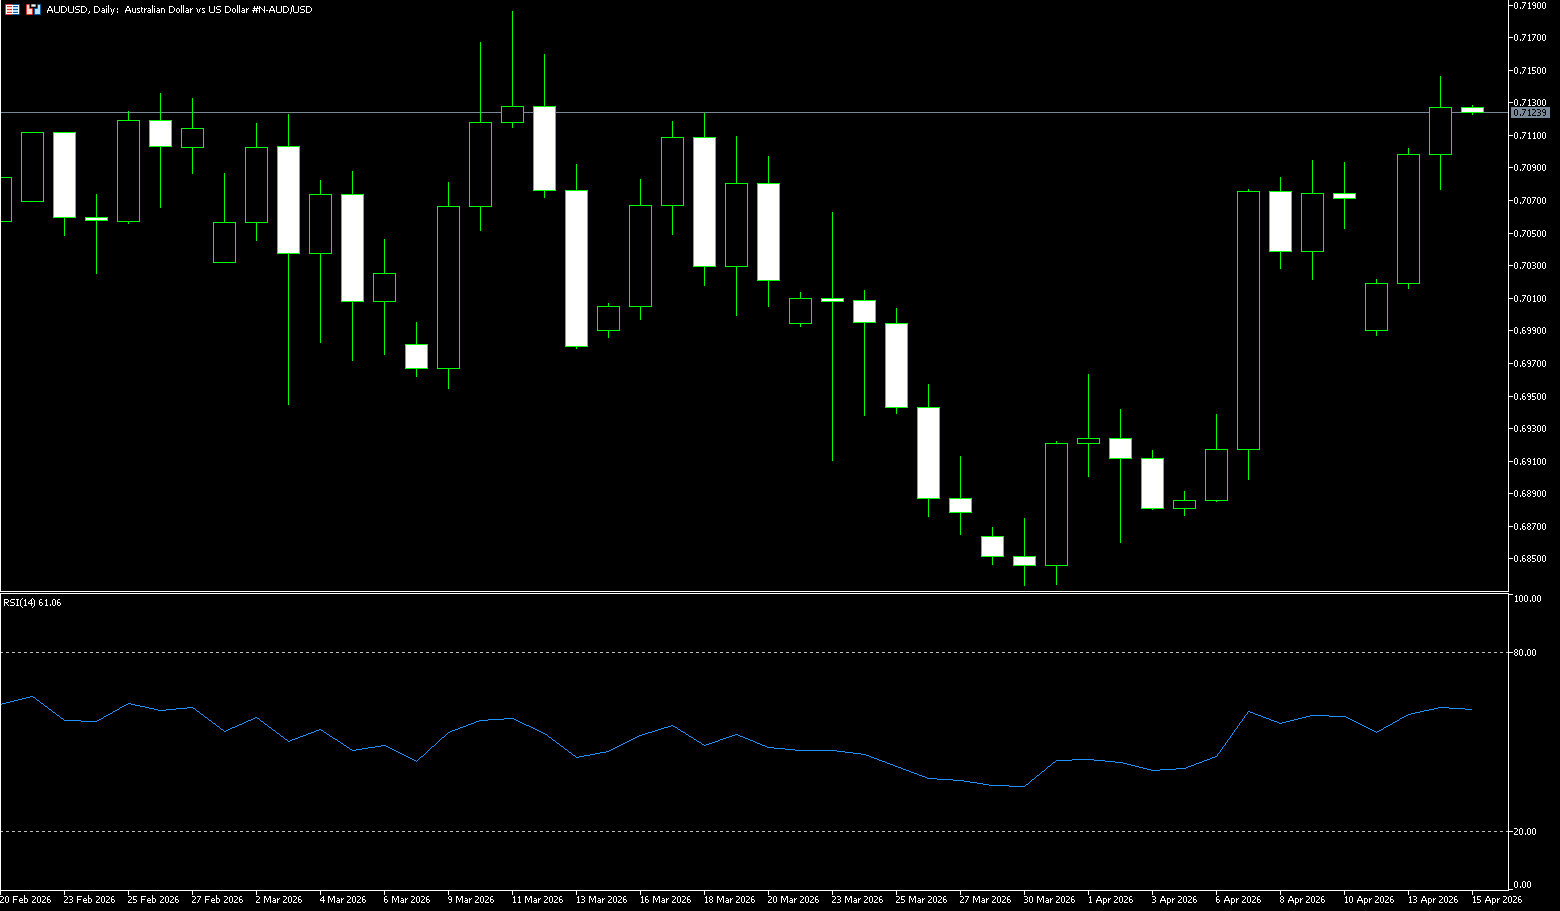
The AUD/USD pair retreated after a modest rise in the previous trading day, trading around 0.7090 in Asian trading on Tuesday. The Australian dollar may regain momentum as the Reserve Bank of Australia (RBA) reinforces its hawkish stance due to persistent energy-driven inflationary pressures. RBA Deputy Governor Andrew Hauser warned that Australia faces a challenging macroeconomic environment, with high inflation and constrained supply capacity, which could increase the risk of stagflation if the energy shock continues. Meanwhile, the dollar came under pressure, with comments from US Vice President Vance offering slight support to risk sentiment, suggesting that diplomatic efforts were ongoing and that the US-Iran conflict might be easing. However, the lack of substantial progress kept oil-related risk premiums high. In an interview with Fox News, Vance expressed cautious optimism about negotiations with Iran, stating that while no breakthrough had been achieved, substantial progress had been made. He said the weekend's discussions were constructive, providing US officials with an opportunity to gain a deeper understanding of Iran's negotiating position.
Spot prices are currently trading within the 0.7000 (psychological level) – 0.7188 (March high) range, with the geopolitical context remaining a key focus. However, as it approaches the key resistance zone of 0.7100, upward momentum may begin to slow. This depends on whether the dollar fails to gain momentum and whether the overall risk environment does not deteriorate. On the daily chart, the AUD/USD pair is trading above 0.7100, maintaining a bullish bias. The 14-day Relative Strength Index (RSI) is around 61.98, indicating positive but not overextended momentum, while the Average Directional Index (ADX) is around 21, suggesting a moderate trend rather than a strong directional impulse. Initial resistance is seen at the 0.7188 area, which coincides with the key resistance level from March 11th, followed by resistance at 0.7200 (a psychological level). Immediate support is seen at the 0.7026 (40-day moving average) area, followed by 0.7000 (a psychological level).
Consider going long on the AUD/USD pair today at 0.7115, with a stop-loss at 0.7100 and targets at 0.7170 and 0.7160.
GBP/USD
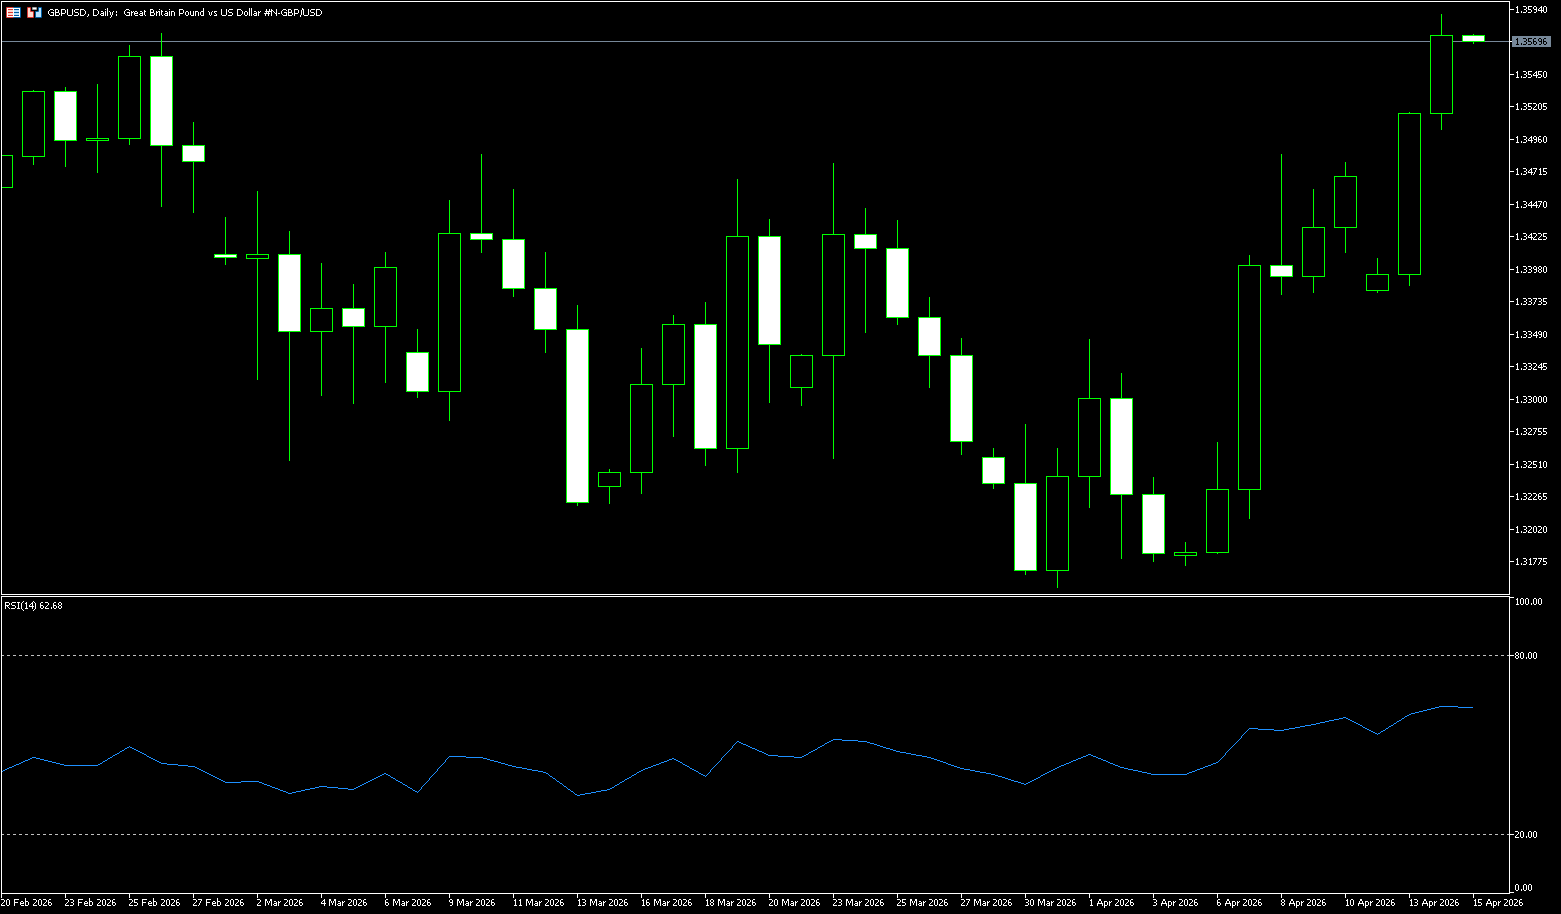
The pound outperformed the dollar during Tuesday's European trading session, but showed mixed performance against other currencies. The dollar weakened as hopes for a second round of US-Iran talks fueled expectations of a permanent ceasefire, pushing the pound/dollar exchange rate to a six-week high of around 1.3568. The first round of talks over the weekend failed to yield a breakthrough, with the US team, led by the vice president, maintaining a firm and uncompromising stance on Iran abandoning its nuclear ambitions and reopening the Strait of Hormuz. Hopes for a second round of talks boosted market sentiment. S&P 500 futures extended Monday's gains overnight, rising to around 6900. The dollar index, which tracks the dollar against six major currencies, fell to around 98.00, its lowest level in over six weeks. Domestically, investors are seeking new clues about the Bank of England's monetary policy outlook, and this week, market participants will focus on Thursday's release of February's monthly GDP data.
On the daily chart, GBP/USD is trading above 1.3500, continuing its constructive bullish bias, with the spot price holding above the 50-day (1.3427) and 200-day (1.3412) simple moving averages. The short-term trend tone remains positive, with the price respecting this overlapping moving average support, although the Stochastic RSI is near 71, suggesting overbought conditions and indicating a potential risk of weakening upward momentum in the short term. On the downside, initial support is now found at the 50-day (1.3427) and 200-day (1.3412) simple moving averages, reinforcing the secondary support zone below. As long as GBP/USD remains above this moving average cluster, bulls are likely to defend against pullbacks, and any corrective pullbacks will be viewed as adjustments within the broader uptrend rather than a trend reversal. Therefore, upside targets to watch are the 1.3600 (psychological level) and 1.3671 (the high of February 12).
Today, consider going long on GBP at 1.3556, with a stop loss at 1.3545 and targets at 1.3590 and 1.3600.
USD/JPY
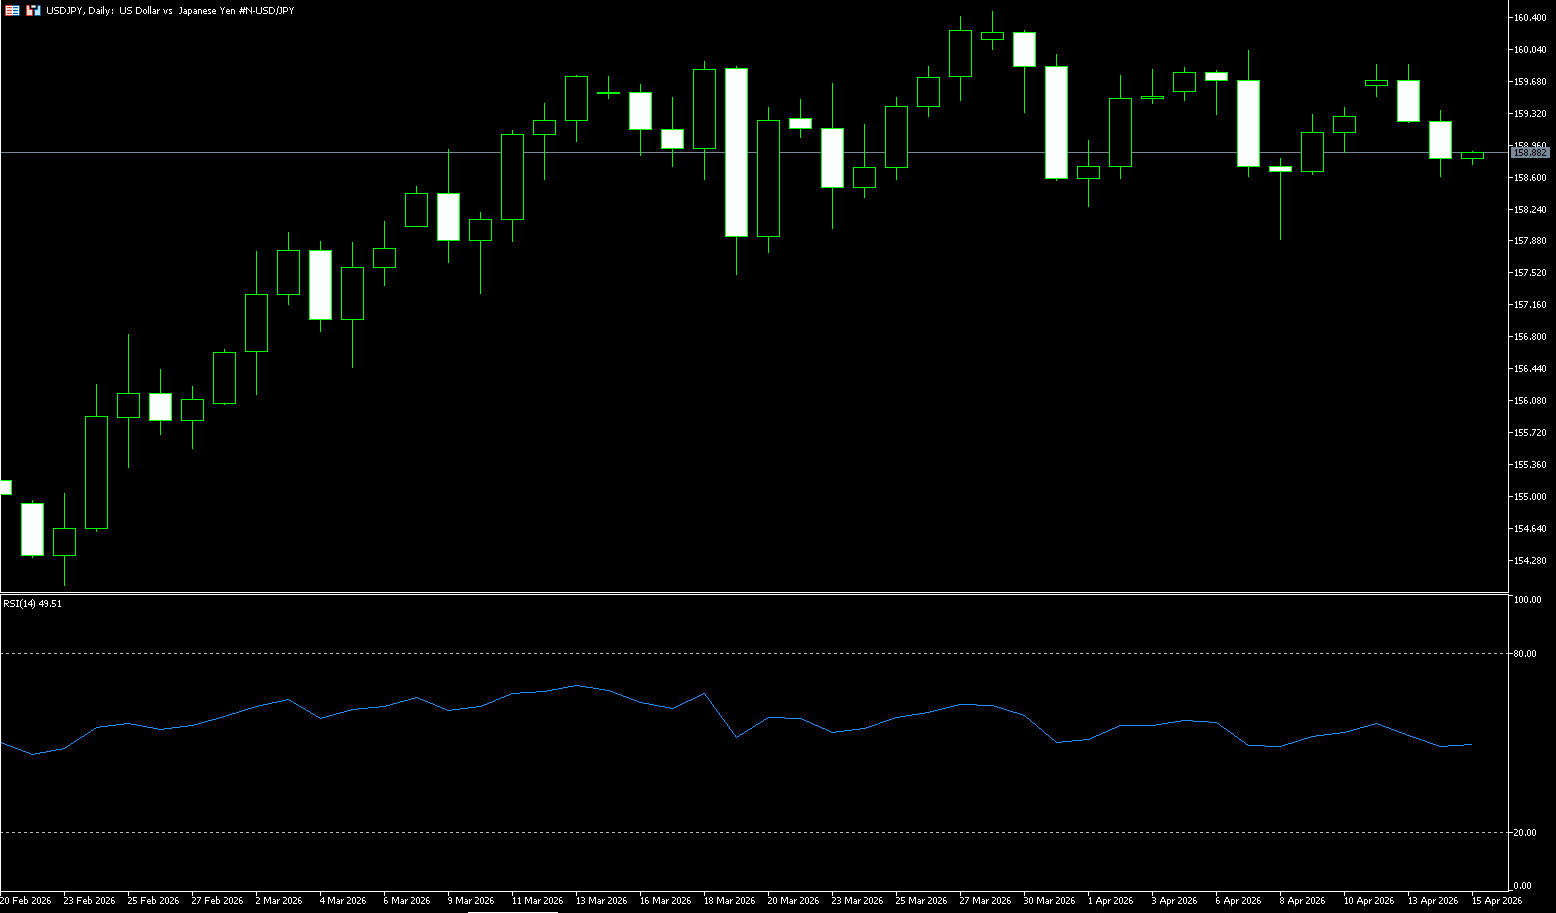
USD/JPY continued to fall below 159.00 on Tuesday as US-Iran diplomatic efforts weakened the dollar's reserve currency status. Furthermore, uncertainty surrounding the Fed's future interest rate direction weighed on the dollar, while concerns about intervention provided some support for the yen. Nevertheless, economic concerns about instability in the Strait of Hormuz may limit the yen's strength and help limit the pair's decline. USD/JPY fluctuated significantly on Monday, briefly rising to a session high near 159.86 before steadily retreating, ultimately closing near 159.35. Since early April, USD/JPY has been oscillating within a 200-pip range of approximately 158.00 to 160.00, with the psychological level of 160.00 continuing to limit upside potential. Speculation is growing in the market regarding a Bank of Japan (BOJ) rate hike in April. A former BOJ executive director recently stated that if the central bank does not take action at its April 27-28 meeting, it may fall behind on inflation. Economy, Trade and Industry Minister Akazawa Ryosuke also joined the policy discussion last week, pointing out that the BOJ's monetary policy could be used as a tool to curb inflation by strengthening the yen.
On the daily chart, USD/JPY is trading around 158.86. The pair remains in negative territory below the opening price of 159.73, indicating a short-term bearish bias. Intraday price action shows a mild pullback from earlier levels. The Stochastic Relative Strength Index (Stochastic RSI) has fallen from near the overbought zone of 90 to the 30 range, suggesting weakening bullish momentum and a loss of control for buyers in the very short term. Initial resistance is around the opening price of 159.73. A break above this resistance would help alleviate immediate downward pressure and could open up more room for a broader intraday rebound to the psychological level of 160. Initial support lies around 158.20 (40-day moving average), serving as immediate intraday support, followed by stronger structural support at 157.89 (last week's low). A deeper pullback could see renewed buying interest there.
Consider shorting the US dollar at 159.00 today, with a stop-loss at 159.20 and targets at 158.20 and 158.00.
EUR/USD
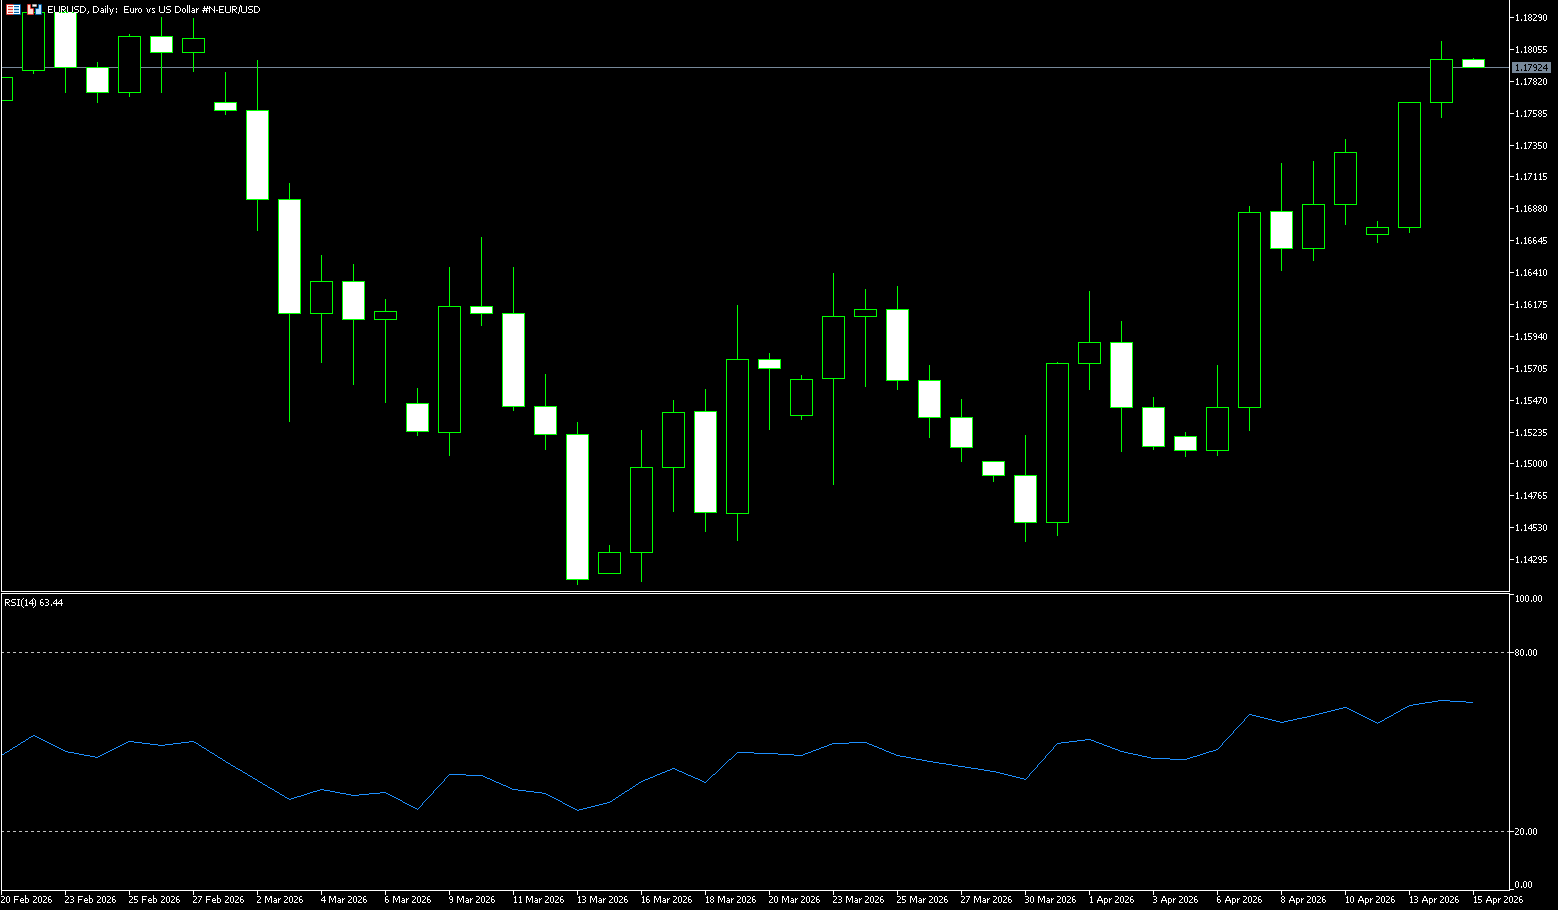
The EUR/USD pair continued its strong intraday rally of over 100 pips in Tuesday's Asian session, gaining further momentum. EUR/USD consolidated near a six-week high of 1.1800 during Tuesday's European session. The pair remained solid as the dollar continued to be pressured by market optimism regarding diplomatic hopes between the US and Iran. This marks the eighth consecutive day of gains, pushing the spot price to a new high since early March, reaching a range of approximately 1.1765-1.1770 in the past hour. Despite the lackluster peace talks over the weekend, investors are still betting on risk assets, hoping that the door to Iranian diplomacy remains open. In fact, US Vice President JD Vance expressed cautious optimism about the negotiations with Iran, stating that while no breakthrough has been achieved, substantial progress has been made. This, in turn, weakens the dollar's reserve currency status and provides momentum for the euro/dollar pair. Concerns about the potential breakdown of the current ceasefire and the resumption of war may provide some support for the dollar, discouraging aggressive bullish bets on the euro/dollar pair.
From a technical perspective, the overnight break above the 1.1670 confluence zone—including the 200-day simple moving average (1.1672) and the 38.2% Fibonacci retracement level of the January-March decline—is favorable for euro/dollar bulls. Furthermore, momentum indicators support a constructive move, with the 14-day Relative Strength Index (RSI) hovering around 62.70, not yet overbought, and the Moving Average Convergence Divergence (MACD) in positive territory. Meanwhile, initial resistance is located at 1.1800 (a psychological level), followed by the 61.8% Fibonacci retracement level at 1.1820, with further resistance at 1.1931 and the previous swing high near 1.2000 (a psychological level). On the downside, short-term support lies at the 200-day simple moving average at 1.1672 and the nearby 38.2% Fibonacci retracement level at 1.1665.
Consider going long on the Euro today at 1.1783, with a stop loss at 1.1770 and targets at 1.1830 and 1.1850.
Disclaimer: The information contained herein (1) is proprietary to BCR and/or its content providers; (2) may not be copied or distributed; (3) is not warranted to be accurate, complete or timely; and, (4) does not constitute advice or a recommendation by BCR or its content providers in respect of the investment in financial instruments. Neither BCR or its content providers are responsible for any damages or losses arising from any use of this information. Past performance is no guarantee of future results.
More Coverage


Risk Disclosure:Derivatives are traded over-the-counter on margin, which means they carry a high level of risk and there is a possibility you could lose all of your investment. These products are not suitable for all investors. Please ensure you fully understand the risks and carefully consider your financial situation and trading experience before trading. Seek independent financial advice if necessary before opening an account with BCR.
BCR Co Pty Ltd (Company No. 1975046) is a company incorporated under the laws of the British Virgin Islands, with its registered office at Trident Chambers, Wickham’s Cay 1, Road Town, Tortola, British Virgin Islands, and is licensed and regulated by the British Virgin Islands Financial Services Commission under License No. SIBA/L/19/1122.
Open Bridge Limited (Company No. 16701394) is a company incorporated under the Companies Act 2006 and registered in England and Wales, with its registered address at Kemp House, 160 City Road, London, City Road, London, England, EC1V 2NX. This entity acts solely as a payment processor and does not provide any trading or investment services.

 English
 简体中文
简体中文
 繁體中文
繁體中文
 Bahasa
Melayu
Bahasa
Melayu
 Tiếng
Việt
Tiếng
Việt
 ไทย
ไทย
 日本語
日本語
 한국어
한국어
 ភាសាខ្មែរ
 español


