


0
Currency & Commodity Analysis:
US Dollar Index
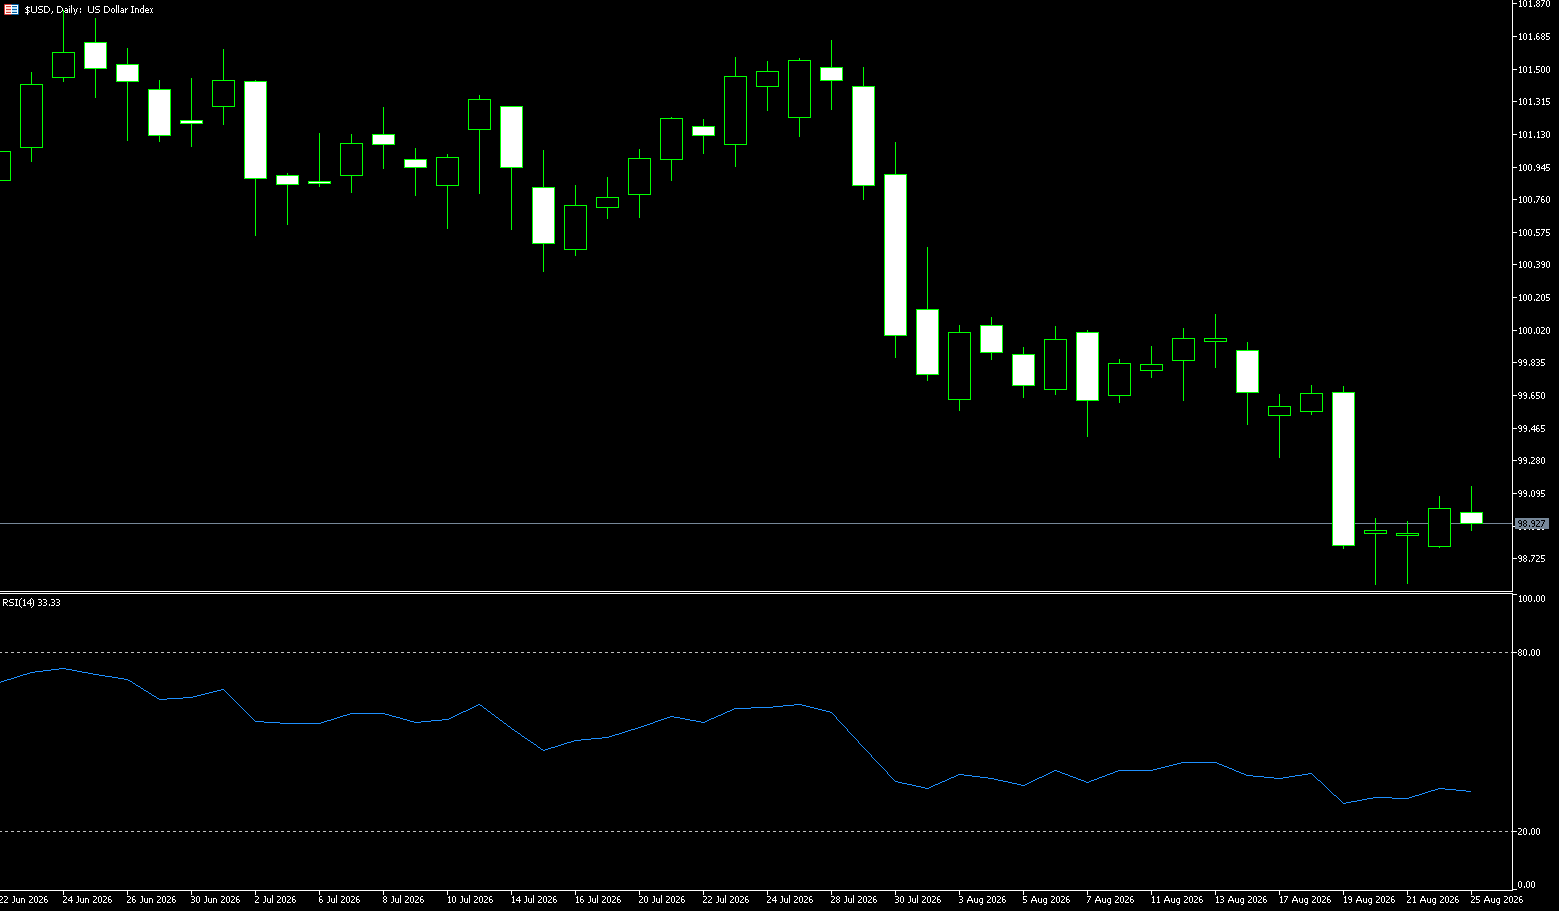
The US dollar index stabilized around 99 on Tuesday, after rising in the previous trading day, supported by safe-haven demand as the US took steps to exclude Iran from the global financial system, highlighting the dollar's central role in international trade. Treasury Secretary Scott Bessant announced on Monday plans to isolate Iran by imposing sanctions on countries doing business with it. However, the dollar remains near three-month lows as the Treasury announced an expansion of its long-term Treasury repurchase program in an effort to control rising borrowing costs. Markets, however, speculate that the program may only provide a temporary solution, while reigniting concerns about the US debt crisis and the risk of a weaker dollar. Elsewhere, investors are awaiting the latest US personal consumption expenditure price index data this week and Federal Reserve Chairman Kevin Warsh's speech at the annual Jackson Hole symposium for new clues about the outlook for monetary policy.
The dollar index continues its downward trend amid a complex interplay of factors, and even some macroeconomic conditions that should have supported the dollar have failed to reverse this weakness. The erosion of market participants' confidence in the Fed's policy stance continues to exert downward pressure on the dollar, becoming one of the core drivers suppressing the dollar index. Even when the macroeconomic environment should have been favorable for the dollar, it has still begun to decline. Generally, declining stock indices, stabilizing US Treasury yields, and Middle East geopolitical conflicts pushing up oil prices should provide strong support for safe-haven assets like the dollar. However, traditional safe-haven logic has completely failed in this round of market activity. The regulatory measures adopted by the Ministry of Finance are continuously eroding market confidence in the Federal Reserve and even further shaking the foundation of global confidence in the US dollar itself. Therefore, downside support can be considered at the low of 98.56. If the daily chart breaks below 98.56, it will further challenge the key support of 98.00. On the upside, pay attention to 99.16 (200-day moving average) and 99.63 (20-day moving average).
Today, consider shorting the US dollar index at 99.00, with a stop loss at 99.10 and targets at 98.60 and 98.55.
WTI Crude Oil
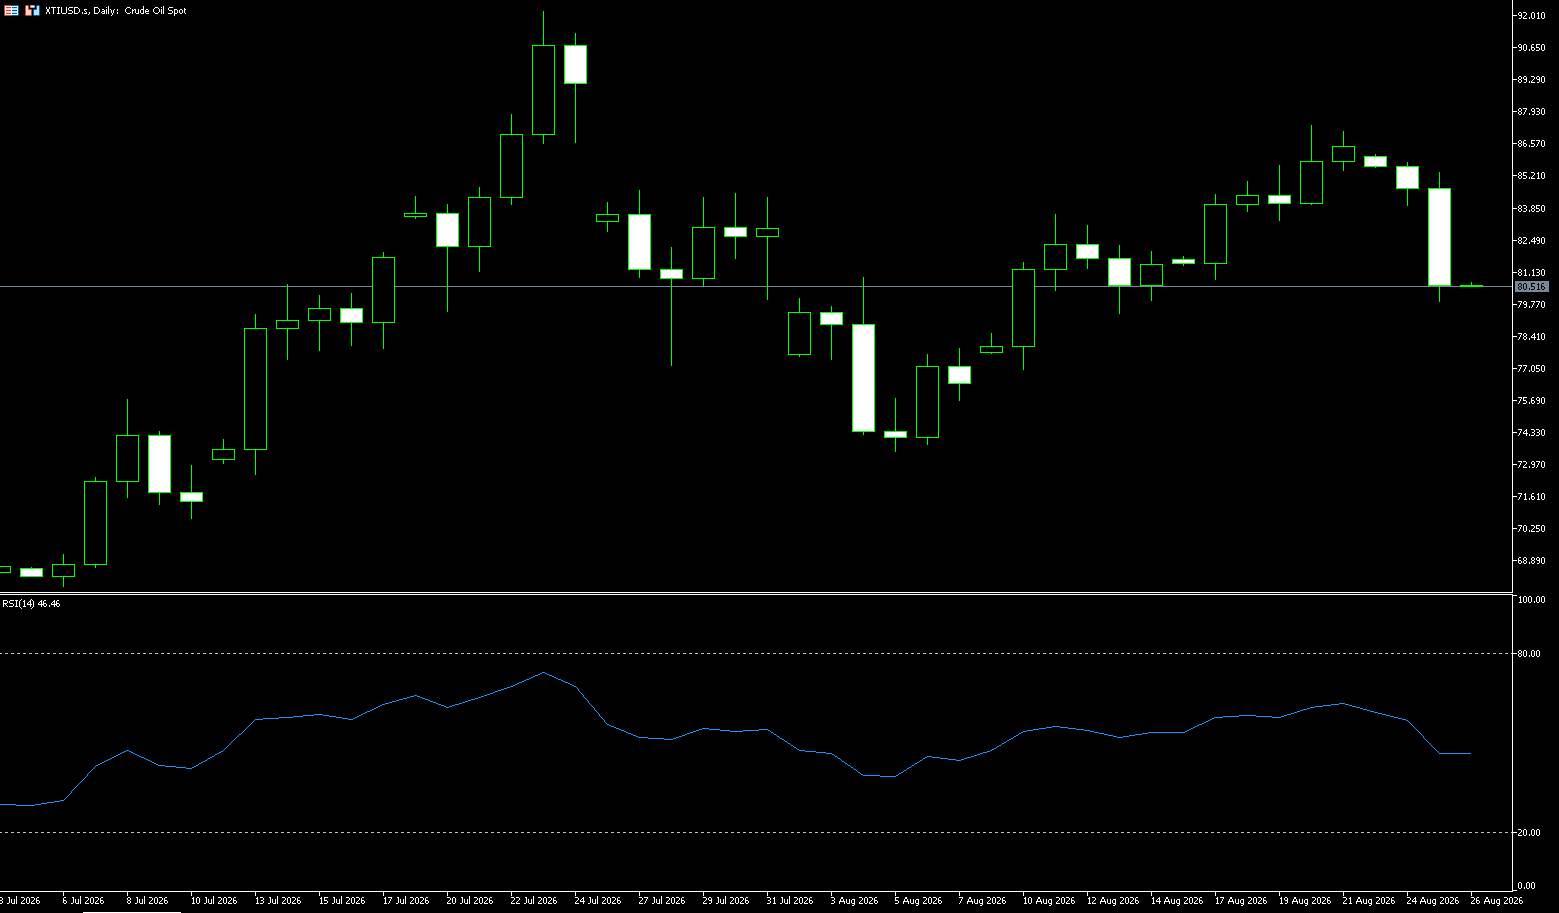
Crude oil prices fell more than 4% on Monday, dropping below $81 a barrel, extending a 2.4% decline from the previous trading session, as investors assessed signs of easing tensions between the US and Iran. Pakistan's military chief visited Tehran to support diplomatic efforts, while Qatar stated it was continuing mediation efforts. Reports that Washington might soon redeploy withdrawn diplomats to the region also suggested that a widespread military escalation might not be so imminent. Meanwhile, Washington's latest measures to increase economic pressure on Iran were less severe than market expectations. US Treasury Secretary Scott Bessant stated that countries trading with Tehran would be given a deadline to end their ties or face unilateral sanctions. Despite these measures, significant amounts of crude oil are still being transported through the Strait of Hormuz, with some shipments being handled covertly.
Looking at the technical charts, disregarding the noise. Over the past ten trading days, WTI crude oil has formed a clear short-term trading range: $80.00-$87.50 per barrel. Currently, at $81.00, it's right below this range, indicating a potential weakening market direction. The 20-day and 50-day moving averages are gradually converging; historically, this pattern has often been followed by increased volatility, suggesting the market is consolidating for a breakout. Immediate support is at $80.00 per barrel, a psychological level and a significant structural turning point, representing the recent low and the first line of defense. If the daily closing price breaks below this level, the next target is $78.59 per barrel (the 55-day moving average). As for resistance, $82.23 per barrel (the 25-day moving average) is a short-term top; the next upside target is the near one-month high of $87.38 per barrel, but to break above this level, a substantial improvement in the physical supply and demand dynamics is needed, not just short-term news-driven stimuli.
Today, consider going long on crude oil at 80.55, with a stop loss at 80.350 and targets at 82.00 and 83.00.
Spot Gold
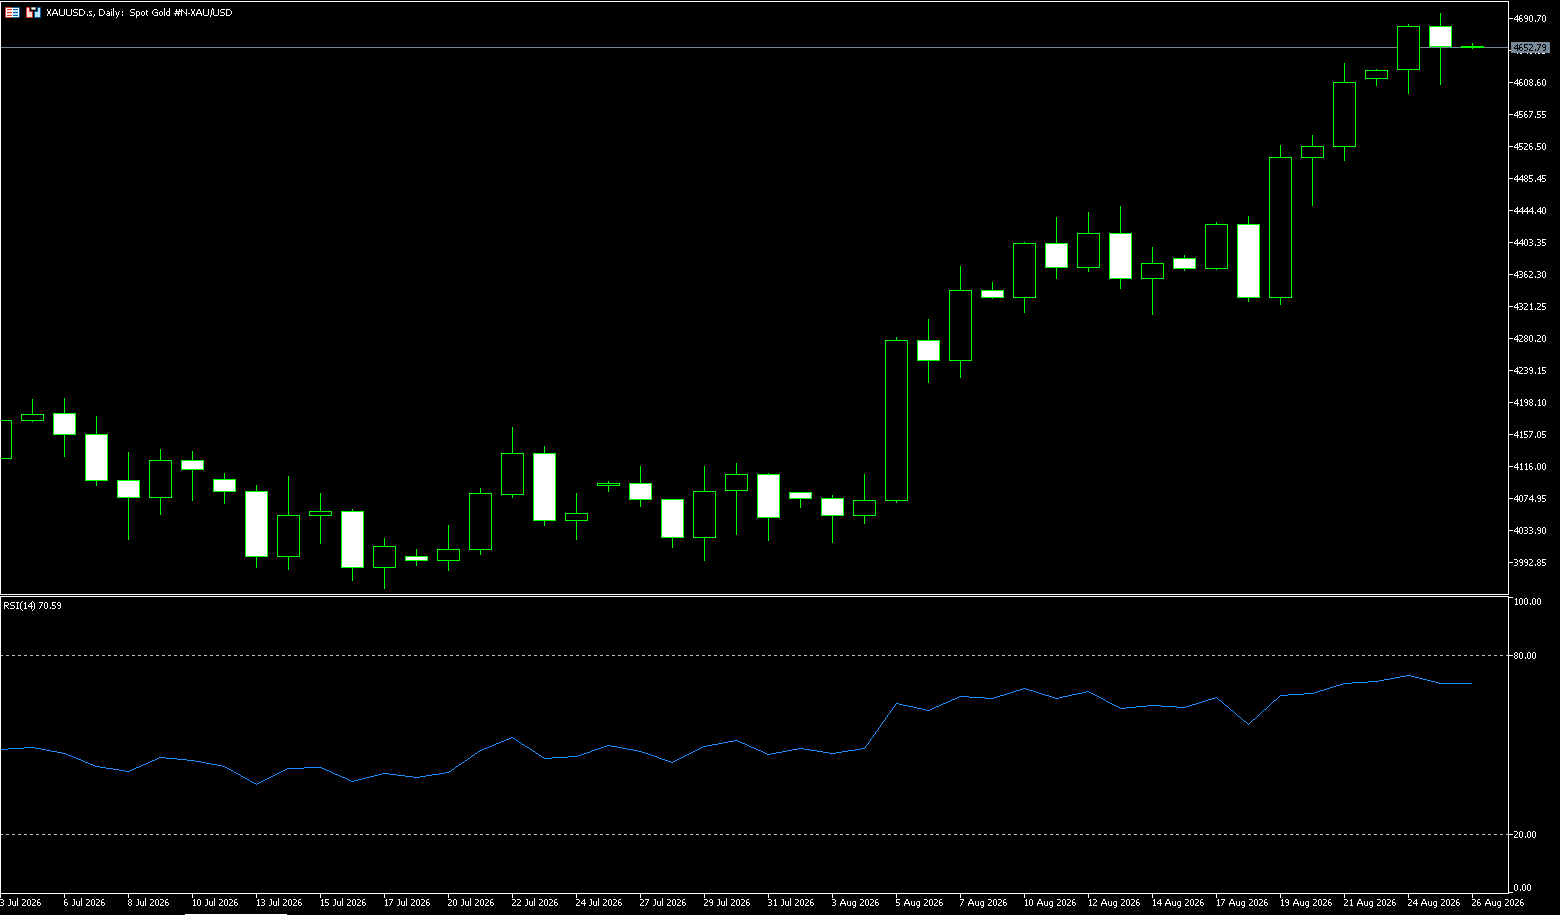
On Tuesday, gold prices continued their upward trend, with spot gold trading at $4,660 per ounce, benefiting from technical buying, a weaker dollar, and the US Treasury's buyback program. It may target the $4,700 per ounce level today. Gold prices broke through the 200-day moving average last week, and global gold ETFs recorded their largest weekly inflow in 10 months ($46.7 tons, approximately $6.4 billion), led by North American and European listed funds. Geopolitically, the Trump administration announced expanded secondary sanctions against entities doing business with Iran, increasing safe-haven demand. Market focus shifted to Wednesday's release of the Fed's preferred inflation gauge, the PCE price index, and Fed Chairman Warsh's first speech at the Jackson Hole Global Central Bank Symposium on Friday to assess the interest rate outlook. However, from a medium- to long-term perspective, the underlying logic supporting gold's upward trend remains unchanged: frequent global geopolitical risks, continued doubts about the dollar's credibility, and the unresolved structural problems of US debt. Gold's substitution effect for the dollar continues to strengthen, providing ample momentum for higher gold prices.
Currently, geopolitical tensions are already sufficient to support risk aversion in the market. Meanwhile, the escalating trade friction between the US and Canada further increases market uncertainty, boosting safe-haven buying of gold. Technical breakouts provide additional momentum for gold price increases. Last week, gold prices strongly broke through the closely watched 200-day moving average (currently around $4,519.80) and rose above the $4,600 mark. The market typically considers a break above the 200-day moving average a clear bullish signal. Currently, gold prices are above all key moving averages. From a broader perspective, spot gold has risen approximately 15% since its July lows. Gold has broken out of a minor bottoming pattern, regained its position above the 200-day moving average, and continued its rebound. The 200-day moving average is considered a key support level. In the short term, $4,700 is a key resistance level. A decisive break above this level would bring the mid-May high of $4,770 and the $4,890-$4,900 area into focus. On the downside, watch for $4,640 (Monday's closing price) and then the $4,600 psychological level.
Today, consider going long on gold at $4,654, with a stop-loss at $4,650 and targets of $4,690 and $4,700.
AUD/USD
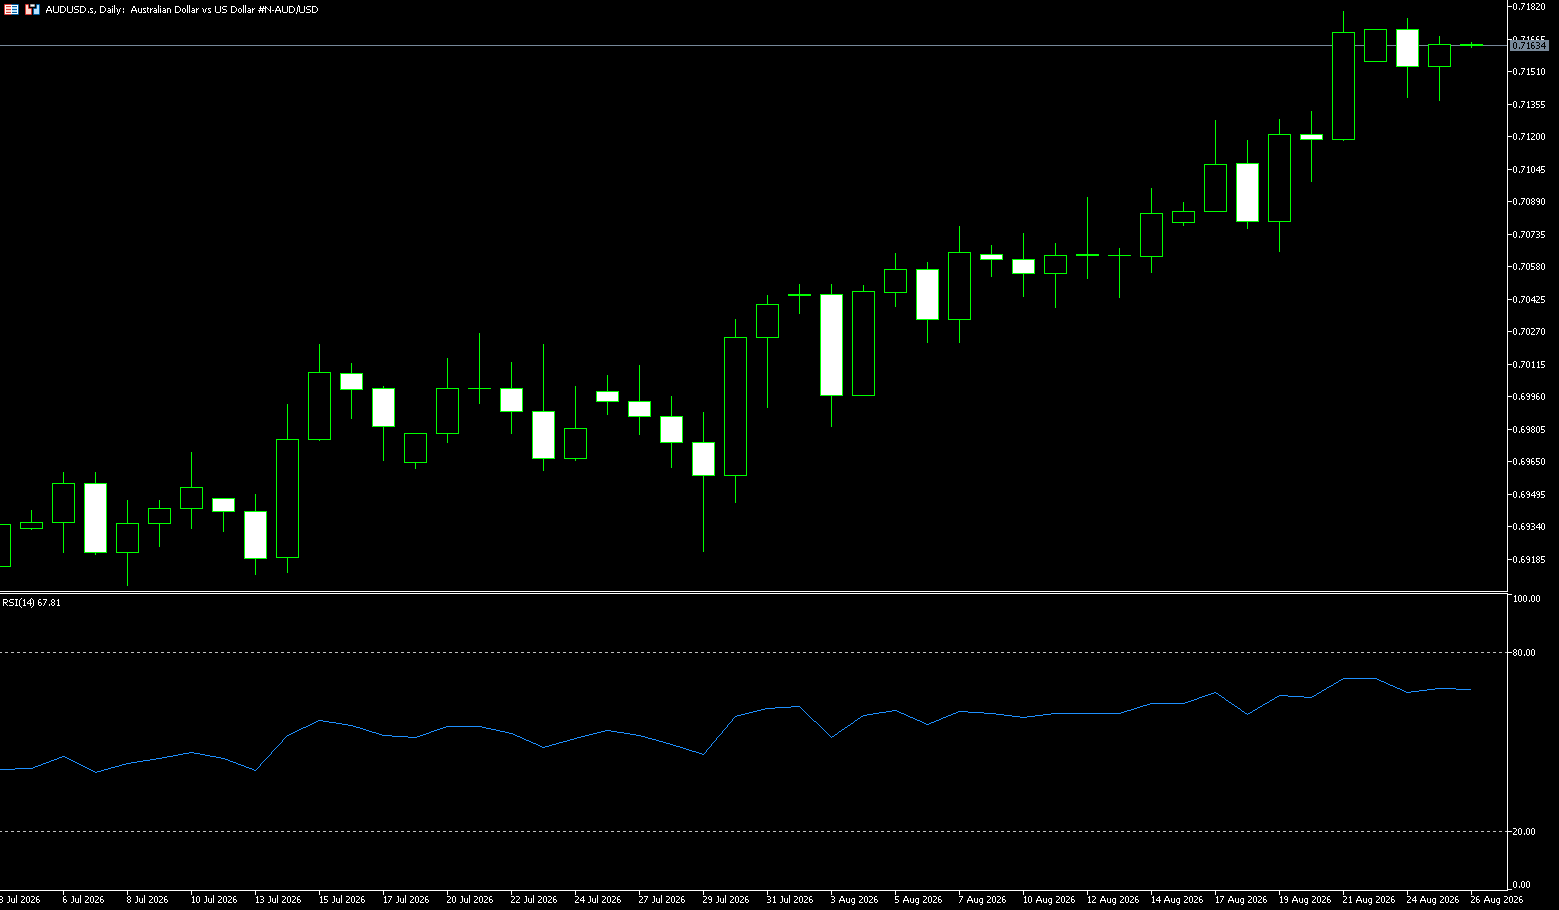
The AUD/USD pair rebounded after a slight decline the previous day, trading around 0.7160 on Tuesday. The Reserve Bank of Australia released the minutes of its July monetary policy meeting on Tuesday, signaling that the board remains prepared to raise interest rates if upside inflation risks materialize. Meanwhile, the US dollar continued to face downward pressure on major currencies, including the Australian dollar, after the US Treasury decided to double the size of its long-term bond repurchase operations. Reports indicate that Treasury Secretary Scott Bessant may use up to $1 trillion from the Treasury's general account to fund these repurchases. Geopolitical tensions are also escalating in tandem, with the US expanding secondary sanctions against entities transacting with Iran. Bessant warned that a large financial institution could face enforcement action this week, noting that Chinese entities would not be exempt. Market focus will culminate on Friday when Federal Reserve Chairman Kevin Warsh speaks at the annual Jackson Hole symposium, expected to provide further clues about the dollar's short-term direction.
On the daily chart, the AUD/USD is trading around 0.7160. With the current price holding above the 55-day, 100-day, and 200-day simple moving averages, the short-term bullish stance remains unchanged, with these moving averages roughly concentrated between 0.7005 and 0.7072. The pair has continued its rebound from the midpoint of 0.69 and is currently testing the upper edge of its recent range. The Relative Strength Index (RSI) (14) is at 65.50, indicating steady but not extreme upward momentum, while the Average Directional Index (14) is in the mid-teens, suggesting the trend is strengthening but still moderate. On the downside, initial support lies around 0.7000 (a psychological level), followed by the 100-day simple moving average at 0.7073, with deeper support at the psychological level of 0.67000. On the upside, resistance is initially seen at the 78.6% Fibonacci retracement level at 0.7188, and 0.7200 (a psychological level) may temporarily limit gains. Only a sustained break above 0.7273 (the high of May 13th) will open the way for a higher rebound target.
Consider going long on the Australian dollar at 0.7150 today, with a stop loss at 0.7140 and targets at 0.7190 and 0.7200.
GBP/USD
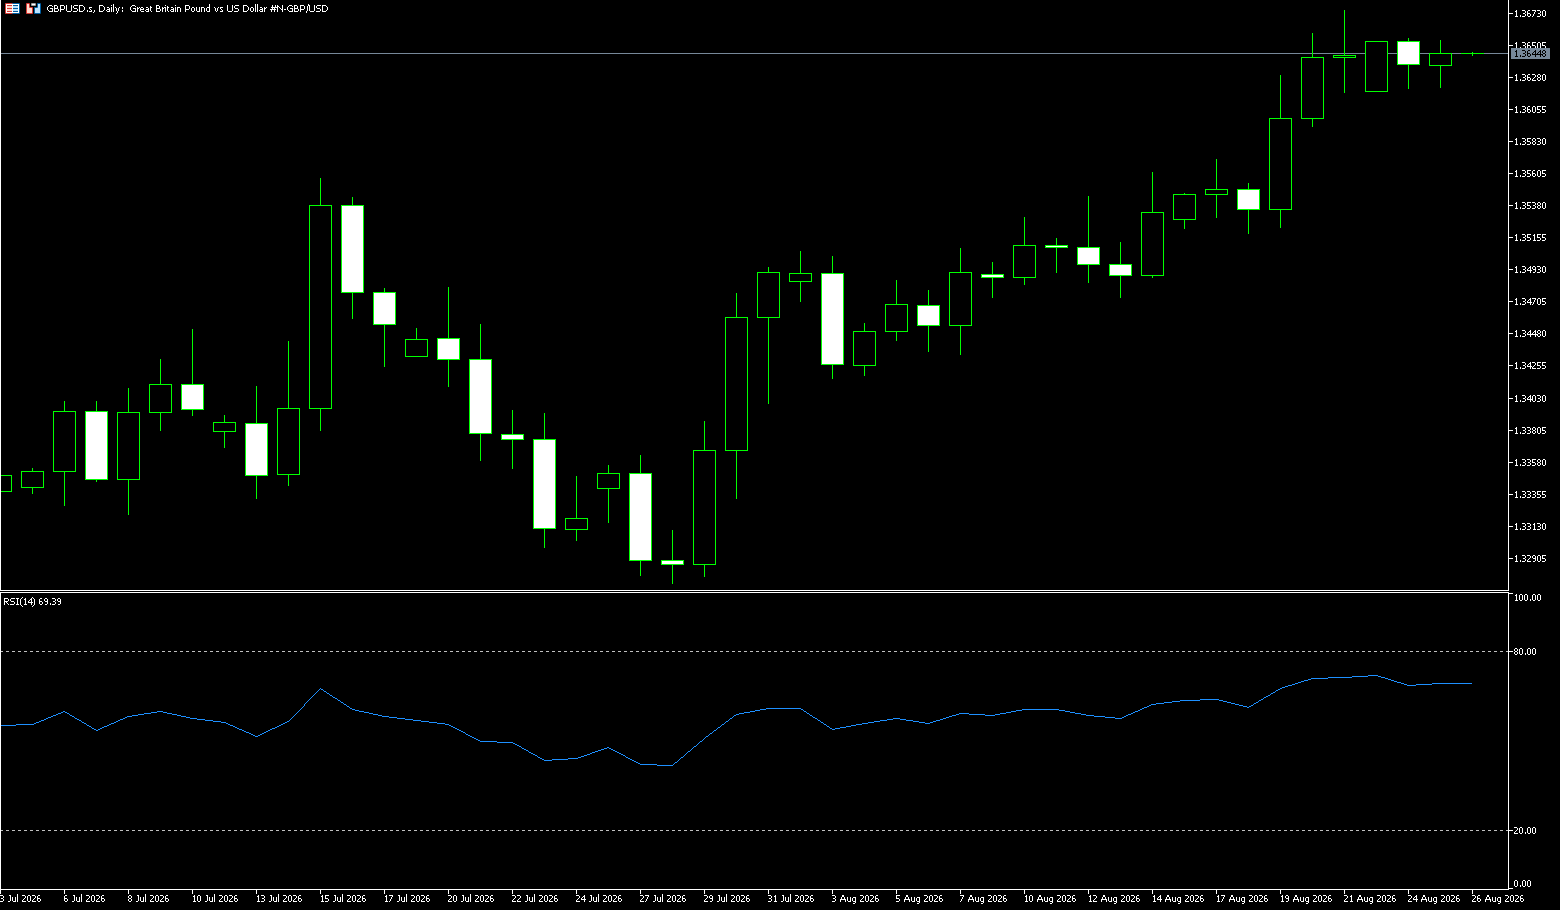
The pound traded above $1.36 in the last full week of August, nearing its strongest level since mid-February, as the US Treasury unexpectedly planned to at least double its purchases of long-term government bonds, putting pressure on the dollar. Investors are also awaiting details on sanctions against Iran, while Fed Chairman Kevin Warsh's speech in Jackson Hole is expected to provide insights into the interest rate outlook. In the UK, money markets continue to anticipate one Bank of England rate hike by the end of the year, followed by another 25 basis point hike by early 2027. Recent data suggests that UK inflation accelerated to 2.9% in July, the highest level since March, while core inflation exceeded expectations at 2.6%. Purchasing Managers' Index data showed faster expansion in business activity, and consumer confidence reached a two-year high in August, providing early support for new Prime Minister Andy Burnham. However, the UK remains vulnerable to high inflation triggered by the Iranian conflict.
On the daily chart, as long as the pound/dollar pair holds above 1.3600, the overall bias remains bullish. A Stochastic Relative Strength Index (Stoch RSI) above 93 is a warning rather than a signal; the real factor ending this rally will be the Fed Chair's reminder on Friday that a December rate hike is still priced in. A daily close below 1.3550 would indicate weakness. Resistance: 1.3675 (last week's high) is limiting the current upside, while the psychological resistance level of 1.3700 is a key dividing line. A break above this level would eliminate supply pressure in this cycle. Support at 1.3600 is the first bottom, having held on every pullback since August 19th. Below that, 1.3550 is the consolidation platform before the breakout; a break below this level would target the 1.3500 (psychological level).
Consider going long on GBP/USD at 1.3636 today, with a stop loss at 1.3625 and targets at 1.3685 and 1.3680.
USD/JPY
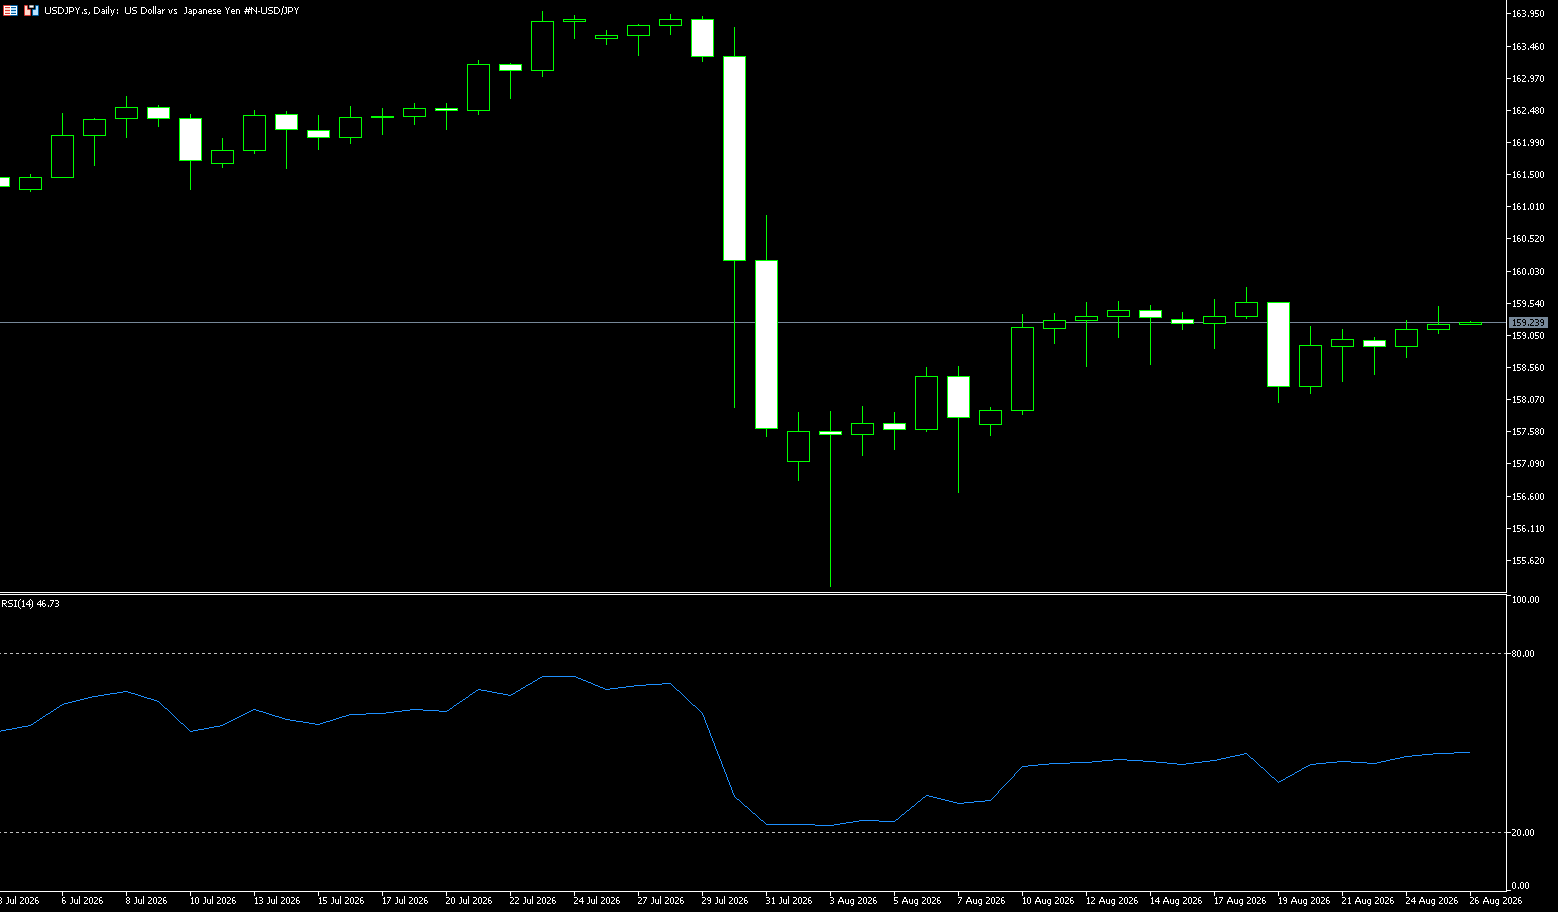
On Tuesday, the USD/JPY pair traded in a narrow range just above the 159.00 level, awaiting a new catalyst to drive the next directional move. Meanwhile, the fundamental backdrop appears bullish, suggesting the path of least resistance for spot prices remains upward. The yen is likely to continue its relative underperformance due to soaring long-term interest rates, a massive government debt burden, and concerns about a deteriorating fiscal situation fueled by expansionary budget pressures. Furthermore, Japanese interest rates remain significantly lower than those of other major economies, keeping so-called yen carry trades active. These factors largely offset the impact of the joint US-Japan monetary intervention at the end of July and are likely to continue supporting the USD/JPY pair. Meanwhile, if the economic war continues, the Islamic Republic will halt all oil exports through the Strait of Hormuz and elsewhere in the Persian Gulf. This keeps the war risk premium present and supports the US dollar.
The USD/JPY pair maintains a mildly bullish bias on the 4-hour chart, trading above the 100-period simple moving average at 159.32 and the 38.2% Fibonacci retracement level of the corrective decline from the 40-year high. On the upside, resistance is seen at the 50.0% Fibonacci retracement level of 159.59, followed by 160 (a psychological level), with higher resistance at the 61.8% Fibonacci retracement level of 160.62. On the downside, initial support comes from the 100-period simple moving average at 158.67 and the 38.2% Fibonacci retracement level near 158.56, with deeper support at the 23.6% level near 157.28. If the current consolidation breaks down to the 157 level, buying is expected to re-emerge.
Consider shorting the US dollar at 159.40 today, with a stop loss at 159.60 and targets at 158.50 and 158.60.
EUR/USD
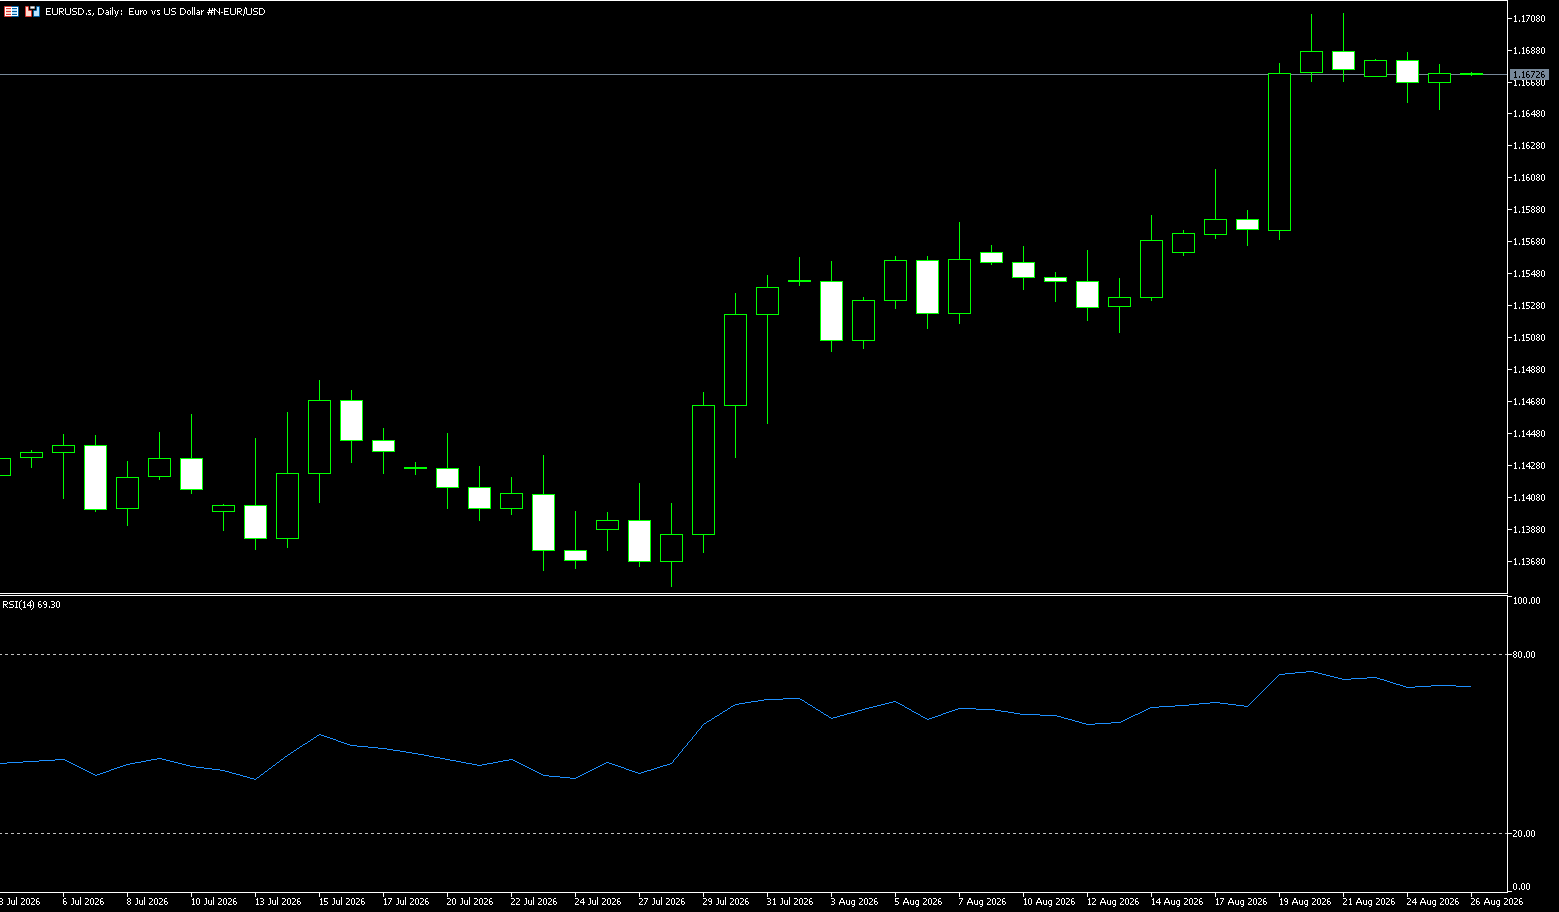
The euro/dollar pair rose slightly after a small decline the previous day, trading around 1.1670 in the Asian session on Tuesday. The euro pair found support due to rising oil prices, higher bond yields, and escalating tensions in the Middle East fueling inflation concerns in the eurozone. These factors boosted market expectations of a more hawkish stance from the European Central Bank (ECB), with the market widely anticipating a further 25 basis point rate hike in September following a tightening in June. Rising US Treasury yields over the past week or so have weakened some of the euro's support. Meanwhile, the dollar remained under pressure after the US Treasury decided to double the size of its long-term bond repurchase operations. Reports indicate that US Treasury Secretary Scott Bessenter may use nearly $1 trillion from the Treasury's general account to fund these operations. Looking ahead, market participants are focused on Federal Reserve Chairman Kevin Warsh's scheduled speech at the annual Jackson Hole symposium this Friday, which could provide further guidance for the dollar.
The euro/dollar pair maintains a short-term bullish bias above the 200-day simple moving average at 1.1631 and the 61.8% Fibonacci retracement level of the April-June decline at 1.1644. This suggests that pullbacks may attract buying, and the broader rally from the 1.1323 cycle low remains intact, potentially testing the 78.6% Fibonacci retracement level at 1.1731. Following that is the April swing high near 1.1843. On the downside, initial support is seen at the 61.8% Fibonacci retracement level at 1.1644 and the 200-day simple moving average at 1.1631, followed by deeper Fibonacci levels at 1.1583 and 1.1600 (a psychological level), while stronger structural demand may emerge near the 1.1571 (20-day simple moving average) anchor.
Today, consider going long on the Euro at 1.1665, with a stop-loss at 1.1655 and targets at 1.1700 and 1.1710.
Stock Analysis:
Australian ASX 200 Stock Index
Basic Market Overview:
The Australian ASX 200 index rose 62 points, or 0.7%, to close at 9,165 on Tuesday, marking its second consecutive day of gains and reaching a more than one-week high. Strong US stock index futures boosted risk appetite after mixed Wall Street closings on Monday, and Treasurer Scott Bessant vowed to "cut off all economic ties with Iran." Traders are focused on Federal Reserve Chairman Warsh's speech in Jackson Hole, key US inflation data, and Nvidia's earnings report. Locally, focus shifts to July inflation data, after June's readings slowed but remained above target, and the Reserve Bank of Australia's meeting minutes emphasized that demand remains in excess. Most sectors rose, with technology, manufacturing, consumer goods, and healthcare leading the gains.
Mining companies drove the benchmark index higher, with BHP Billiton up 0.8% and Rio Tinto up 1.0%. Gold stocks rose, including Northern Star Resources (0.6%) and Evolution Mining (1.0%). The four major banks saw gains ranging from 0.1% to 0.8%. In contrast, PLS Group fell 6.0%, while Woodside Energy (-1.4%) and St. Toth (-1.3%) also performed poorly.
Sector Performance:
Leading Gains: Information Technology +2.25%, Consumer Staples +2.11%, Healthcare +1.40%, Financials Sector Strengthens
Lagging Gains: Energy Sector -0.78%, REITs Real Estate Investment Trusts Close Slightly Down -0.11%; Materials Sector Diverges, Large Mining Companies BHP and Rio Rise, Lithium Mining Stocks Decline
Key Highlights: BHP Hits New High; Healthcare Stocks Ansell and CSL Rise Significantly; Some Lithium Mining Stocks See Profit-Taking
Technical Analysis:
ASX 200 Index Closes at 9165 Points on Tuesday, Up 62 Points, +0.68%, Marking the Second Consecutive Day of Gains and Reaching an 8-Day High; Candlestick Pattern: Closes with a Medium-Sized Positive Candle, Holding Above Short-Term Moving Averages, Rebounding from Last Week's Low of 9019, Successfully Breaking Through the 9100 Level, Still Has Room to Reach the Historical High of 9296.7. The bulls dominated the day, with broad market participation and a significant outflow of stocks rising compared to falling. Intraday support: 9100; Intraday resistance: 9180-9200. Strong medium-term support: 9000-8900 range, with previous highs now acting as a key support zone.
On Wednesday, the ASX200 index's technical structure shows the rebound from the 9019 low is still underway. As long as the key support level of 9000 is not effectively broken, the medium-term bullish trend remains unchanged. However, approaching historical highs, selling pressure is gradually increasing, making a short-term pullback and consolidation likely. The proposed scenarios are: 1. Stronger scenario: Holding above 9100, the bulls continue, testing 9200; a breakout above 9240 with significant volume will challenge the historical high of 9297. 2. Neutral Fluctuation: Fluctuating within the 9100-9200 range, awaiting the release of Australian CPI data, and digesting Tuesday's gains.
3. Weakening Scenario: A decisive break below 9100 and a close below it indicates weakened rebound momentum, with a retest of the 9000-9040 support zone.
Trading Strategy:
Short-Term Trading Strategy (Intraday - 3-Day Perspective)
1. Bullish Strategy
• If it stabilizes near 9100, a rebound can be considered, targeting 9180-9200; if it breaks above 9200 with significant volume, the target is around 9240.
• Stop-Loss Reference: Exit if it breaks below 9070.
2. Bearish Strategy
• If it rallies to the 9200-9240 range and encounters resistance, a pullback can be considered, targeting 9120-9100.
• Stop-loss reference: Exit the market if the price holds above 9297.
3. Observation/Wait-and-See Approach: With the CPI and Jackson Hole speeches approaching, the data is likely to cause gaps and volatility. It is advisable to wait for the data to be released before making a directional decision.
Key Risk Warnings:
1. Higher-than-expected Australian July CPI data will strengthen expectations of a Reserve Bank of Australia (RBA) rate hike, suppressing risk appetite in the stock market and potentially triggering a market correction.
2. Speeches by central bank officials during Jackson Hole and changes in the US-Iran geopolitical situation will lead to significant fluctuations in US stocks and commodities, directly impacting the ASX200.
3. Earnings season may see weaker-than-expected performance from heavyweight stocks, potentially dragging down the overall market; the energy and mining sectors are also highly volatile due to commodity price fluctuations.
4. If the index breaks below the 9000 support level, the rebound structure will be destroyed, opening up further downside potential.
China's Shanghai Composite Index
Basic Market Overview:
The Shanghai Composite Index rose 0.19% on Tuesday to close at 3,889.4 points, while the Shenzhen Component Index fell 0.35%, nearing a one-month low of 13,745.9 points, as weakness in technology stocks led to mixed performance among benchmark indices. Investors continued to reduce their exposure to the sector ahead of a key earnings week, with Nvidia's results on Wednesday expected to test confidence in AI deals. In China, Yealink Technology's shares fell 2.70% despite reporting strong annual revenue and net profit growth.
Other companies that saw significant declines included Hua Hong Semiconductor (-1.08%), InnoLight Technology (-2.78%), and North China Microelectronics (-1.06%). In contrast, Luxshare Precision Industry rose 2.1% after reporting first-half profit and revenue growth. Meanwhile, investors are also turning their attention to the National People's Congress Standing Committee meeting from August 25 to 28, hoping for policy signals that could support growth as economic momentum slows.
Sector Performance:
Leading Declining Sectors: Information & Communication, Semiconductor Equipment, Insurance; SoftBank Group, Advantest Test, and Kioxia Holdings saw the largest declines.
Leading Gaining Sectors: Services, Construction, Other Products; Defensive and cyclical sectors at lower levels showed relative resilience.
Technical Analysis:
The Shanghai Composite Index closed at 3889.44 points on Tuesday, up 0.19%, with an intraday range of 3850.86-3896.21 points. Shanghai market turnover was 858.874 billion yuan, bringing the total turnover of both Shanghai and Shenzhen stock exchanges to 1.83 trillion yuan, a significant decrease compared to the previous trading day. K-line: A small positive candlestick opened lower and closed higher. The price tested the 3850 level in the morning, finding support at the bottom. It rebounded in the afternoon, but faced heavy selling pressure near 3900, leading to a pullback. The closing price remained below the 20-day moving average. The 5-day and 10-day moving averages are trending downwards, indicating a bearish short-term moving average alignment. This suggests a low-volume, oversold correction, with weak buying interest. Market characteristics: Indices and individual stocks diverged. The Shanghai Composite Index closed slightly higher, but the ChiNext Index weakened. Market hotspots rotated rapidly, with heavyweight stocks providing support and smaller stocks showing higher activity. Insufficient volume limited the rebound's potential.
Wednesday Technical Outlook: Moving Averages: The 5-day moving average provides direct resistance, while the 20-day moving average around 3910 forms strong resistance. Only a break above 3900 with increased volume will open up further upside potential. If volume continues to shrink, the price will likely remain within the 3850-3900 range, fluctuating sideways. Volume Requirements: The combined trading volume of the Shanghai and Shenzhen stock exchanges needs to return to above 1.95 trillion yuan for the rebound to be sustainable; continued low volume suggests a potential pullback after a surge, retesting lower support levels. Two possible scenarios for Wednesday are anticipated: Slightly bullish: Holding above 3870, with increased volume challenging the 3900-3910 resistance zone; Slightly bearish: A break below 3850 support increases the risk of a second downward move, targeting the 3830-3845 range.
Trading Strategy:
Operation Strategy (Short-term perspective)
1. Position Control: Currently in a low-volume recovery phase, full positions are not advisable; a medium position is recommended for short-term traders, maintaining cash reserves to cope with volatility.
2. Long Position Conditions: If the index retraces to the 3865-3870 support zone with strong support and increased volume, moderate buying is possible; consider adding to positions only after a significant volume break above 3900.
3. Defensive Conditions: If the price breaks below 3850 intraday and fails to recover quickly, reduce short-term positions to avoid the risk of a second pullback.
Key Risk Warnings:
1. Currently, short-term moving averages are in a bearish alignment. The rebound is a low-volume correction, not a trend reversal, and there is a risk of a pullback after a surge.
2. Sector rotation is rapid, hot spots have weak sustainability, and there is significant divergence between individual stocks and the index. Index stabilization does not mean all stocks will rise simultaneously.
3. Volatility in overseas markets and changes in news may trigger gaps in A-shares. Maintain strict discipline regarding position stop-loss orders.
Disclaimer: The information contained herein (1) is proprietary to BCR and/or its content providers; (2) may not be copied or distributed; (3) is not warranted to be accurate, complete or timely; and, (4) does not constitute advice or a recommendation by BCR or its content providers in respect of the investment in financial instruments. Neither BCR or its content providers are responsible for any damages or losses arising from any use of this information. Past performance is no guarantee of future results.
Lebih Liputan






2026 © - All Rights Reserved by BCR Co Pty Ltd
Pendedahan Risiko:Instrumen derivatif diniagakan di luar bursa dengan margin, yang bermakna ia membawa tahap risiko yang tinggi dan terdapat kemungkinan anda boleh kehilangan seluruh pelaburan anda. Produk-produk ini tidak sesuai untuk semua pelabur. Pastikan anda memahami sepenuhnya risiko dan pertimbangkan dengan teliti keadaan kewangan dan pengalaman dagangan anda sebelum berdagang. Cari nasihat kewangan bebas jika perlu sebelum membuka akaun dengan BCR.
BCR Co Pty Ltd (No. Syarikat 1975046) ialah syarikat yang diperbadankan di bawah undang-undang British Virgin Islands, dengan pejabat berdaftar di Trident Chambers, Wickham’s Cay 1, Road Town, Tortola, British Virgin Islands, dan dilesenkan serta dikawal selia oleh Suruhanjaya Perkhidmatan Kewangan British Virgin Islands di bawah Lesen No. SIBA/L/19/1122.
Open Bridge Limited (No. Syarikat 16701394) ialah syarikat yang diperbadankan di bawah Akta Syarikat 2006 dan berdaftar di England dan Wales, dengan alamat berdaftar di Kemp House, 160 City Road, London, England, EC1V 2NX. Open Bridge Limited bertindak semata-mata sebagai pemproses pembayaran untuk BCR Co Pty Ltd dan tidak menyediakan sebarang perkhidmatan kewangan, perdagangan atau pelaburan bagi pihaknya. Peranan Open Bridge Limited adalah terhad kepada pemprosesan pembayaran.


 English
 简体中文
简体中文
 繁體中文
繁體中文
 Bahasa
Melayu
Bahasa
Melayu
 Tiếng
Việt
Tiếng
Việt
 ไทย
ไทย
 日本語
日本語
 한국어
한국어
 ភាសាខ្មែរ
 español