


0
Currency & Commodity Analysis:
US Dollar Index
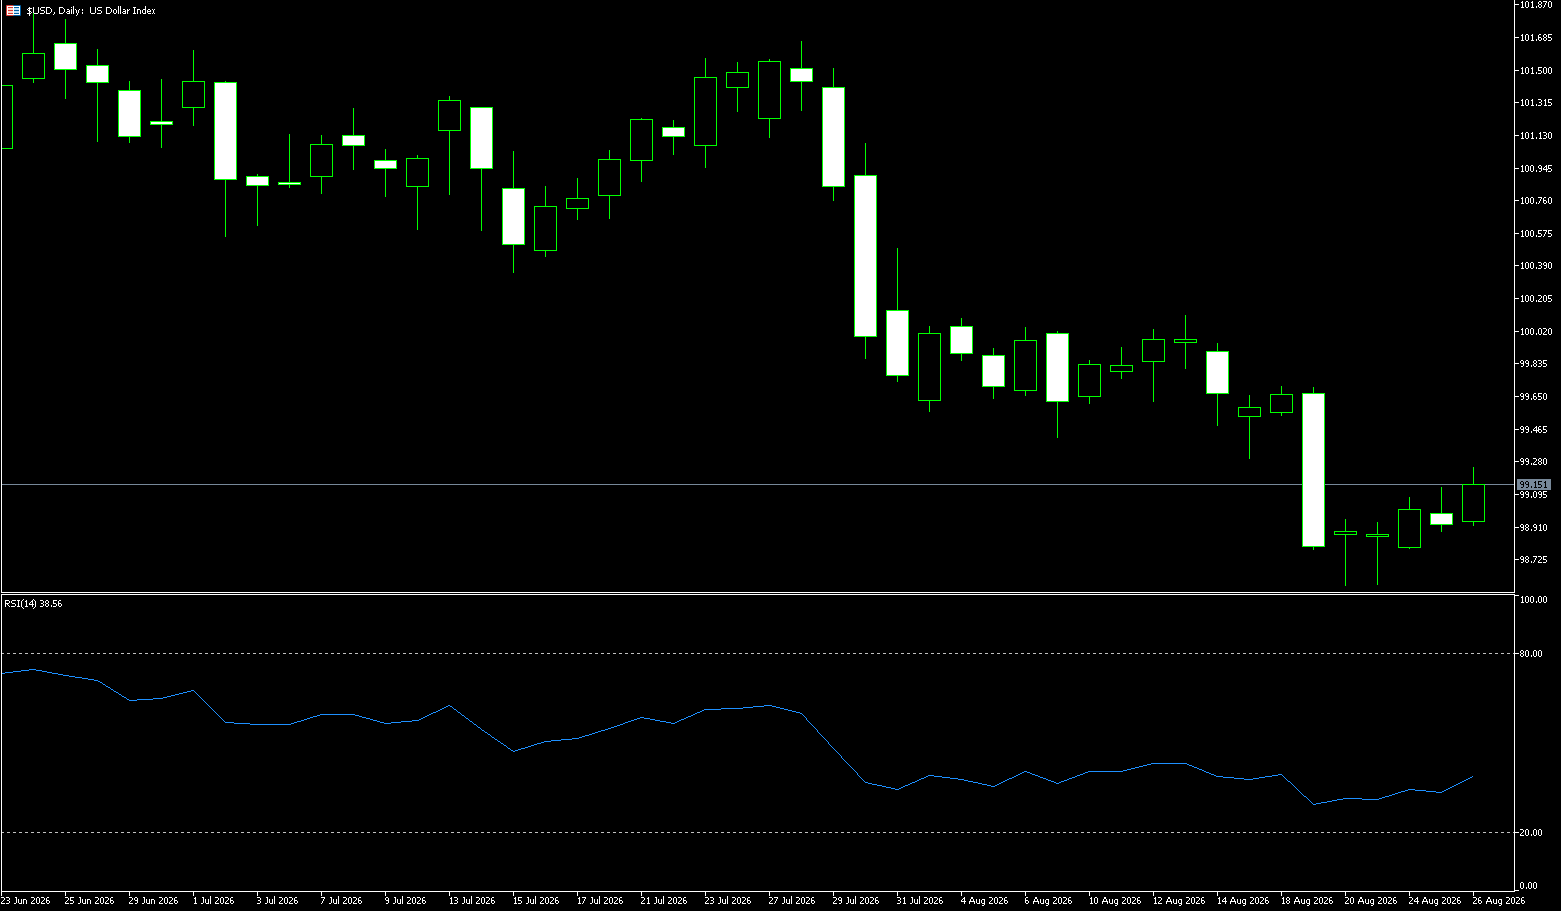
The US dollar index rose for the second consecutive trading day and is approaching the 99 level again. Escalating geopolitical risks and market risk aversion are providing support for the dollar. However, the dollar's rise was somewhat limited after the US Treasury expanded its long-term Treasury bond repurchase program. With PCE inflation data and the Jackson Hole symposium approaching, the market will reassess the Fed's policy path, and the dollar remains in a phase of both short-term rebound and medium-term weakness. The dollar index continued its rebound in Asian trading on Wednesday, holding near 99.00, marking its second consecutive day of gains. The main support for the dollar recently came from safe-haven inflows and market repricing of global geopolitical risks. Following the US expansion of secondary sanctions against entities doing business with Iran, market concerns about energy supply, global inflation, and financial market volatility have intensified, providing some buying support for the dollar as a traditional safe-haven asset.
Driven by both US sanctions against Iran and US-Canada trade frictions, the dollar has begun its rebound. Investors are also speculating whether this dollar rebound is a short-term impulsive move or the beginning of a new trend. From a daily technical perspective, the dollar index is currently trading around 99.00, and although it has rebounded for two consecutive trading days, it remains in a generally weak position. The index remains below its short-term and medium-term exponential moving averages, with the 14-day RSI around 33, nearing oversold territory, indicating that bearish momentum still dominates, but the short-term downside potential has narrowed. The first resistance level is around 99.22; a decisive break above this level would target the medium-term moving average resistance around 99.98. Only a re-establishment above 100 would significantly improve the short-term structure of the US dollar index. On the downside, the low of last week at 98.56 is a key level to watch; a break below 98.56 would further challenge the key support at 98.00.
Today, consider shorting the US dollar index at 99.20, with a stop-loss at 99.30 and targets at 98.90 and 98.80.
WTI Crude Oil
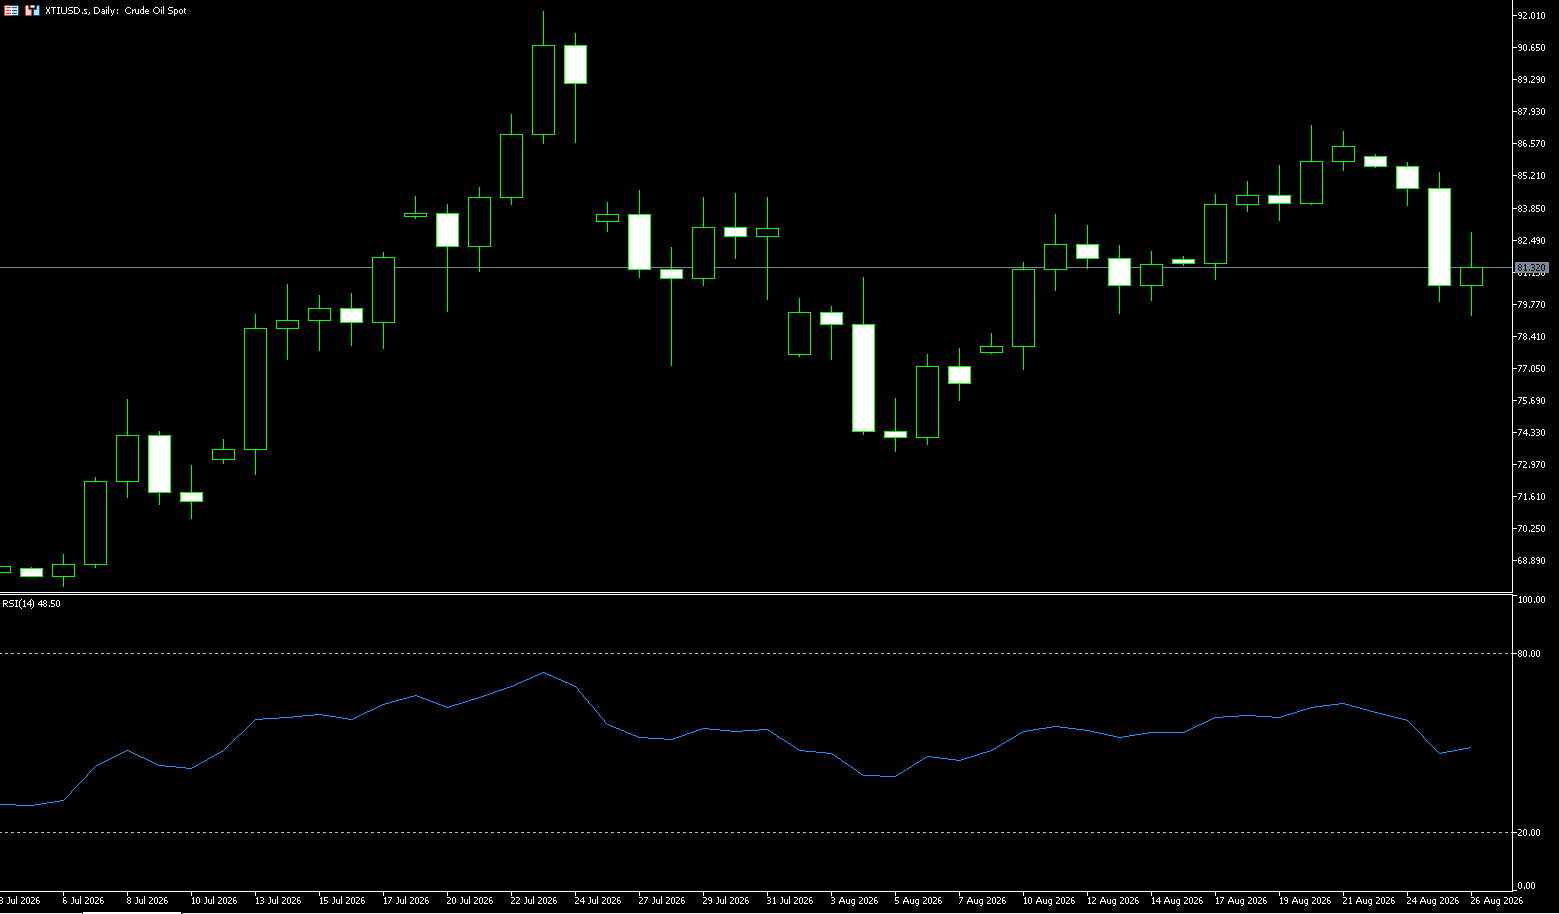
On Wednesday (August 26th, Beijing time) in early Asian trading, WTI crude oil remained range-bound above $80. The international crude oil market is reassessing the risk premium brought about by changes in the Middle East situation. Pakistan signaled diplomatic efforts, with the Pakistani army leader visiting Tehran and reportedly carrying a plan to ease tensions and resume negotiations, increasing market expectations for a de-escalation of the regional situation. Following the announcement, crude oil prices came under pressure, closing down more than 4.0% on Tuesday, as market focus shifted from supply disruption risks to whether diplomatic progress could alter energy flow expectations. Market traders believe that the latest US economic sanctions against Iran pose a lower risk to oil supply than an escalation of military conflict. Some traders also believe the sanctions are less severe than expected. Furthermore, the shift from military confrontation to economic pressure between the US and Iran has rekindled hopes for a negotiated solution, further alleviating concerns about supply disruptions.
From a technical perspective, WTI crude oil's recent price action reflects a clear sentiment-driven pattern. Charts show a continuous decline from highs, with the candlestick pattern showing a series of corrective movements. Regarding the moving average system, medium-term trend indicators remain in a corrective phase, with a deviation between the price and the medium-term moving average, reflecting the lingering impact of previous capital outflows from risk assets. MACD data shows the fast and slow lines in a low-level area, with the histogram showing some contraction after a period of sustained expansion, indicating a change in market momentum, but the balance of power between bulls and bears is still being rebalanced. Technically, a small double-top pattern is currently forming over the past two days, with oil prices currently retracing to near the 65-day moving average. Support is currently at $80.14 (the 65-day moving average) and around $80.00 (a psychological level), which is also the location of the previous downward gap that the bulls recently breached. If the closing price falls below this area, the next target is $77.04/barrel (200-day moving average). Resistance is near $82.12 (30-day moving average), followed by $85.35 (Tuesday's high).
Today, consider going long on crude oil at 81.30, with a stop loss at 81.15 and targets at 82.50 and 83.00.
Spot Gold
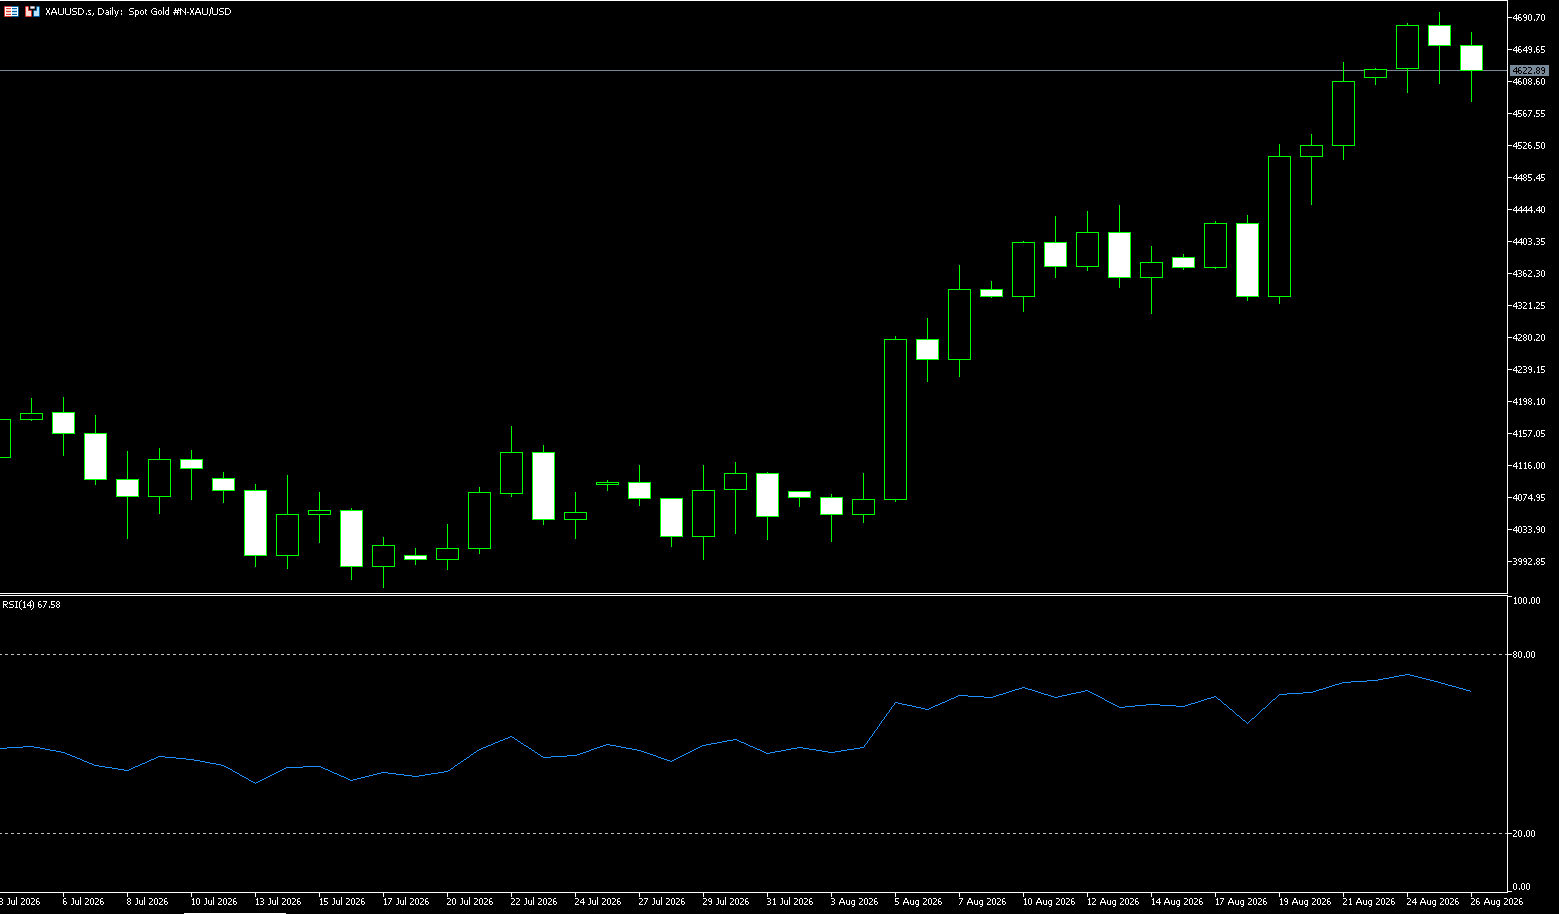
On Wednesday, spot gold traded around $4,600 per ounce. Gold prices retreated after hitting a more than three-month high of $4,698 per ounce on Tuesday, as they lost upward momentum near strong resistance around $4,700 per ounce. Meanwhile, investors were digesting the US Treasury's decision to double the size of its long-term bond repurchase operations. Gold prices remained volatile, with bulls failing to break through the $4,700 level, and prices further retreated below this important psychological level. This was due to mixed US data and increasing market expectations for a resolution to the US-Iran conflict. Gold has entered a consolidation phase, with bullish momentum waning and the Relative Strength Index (RSI) entering overbought territory. Geopolitical tensions remain a key influencing factor: Axios News, citing sources, reported that two US officials confirmed President Trump's announcement that the US Navy has cleared the Strait of Hormuz's separation channel for shipping.
Gold traded sideways for the second consecutive day, with bulls unable to break through the $4,700 psychological level, causing prices to fall back to around $4,600. The RSI indicator is above 70 in overbought territory but is turning downwards. If the RSI breaks below 70, spot gold may further test key support levels. The first support level is $4,550, followed by the 200-day simple moving average at $4,523; below that is the $4,500 level, and then the 100-day moving average at $4,379. For a renewed upward trend, gold prices must regain a foothold above the $4,700 psychological resistance level. A successful breakout could see a move towards the May 7 high of $4,764, followed by a test of the $4,800 psychological level, with the next target at $5,000.
Consider going long on gold today at $4,590, with a stop-loss at $4,585 and targets of $4,640 and $4,650.
AUD/USD
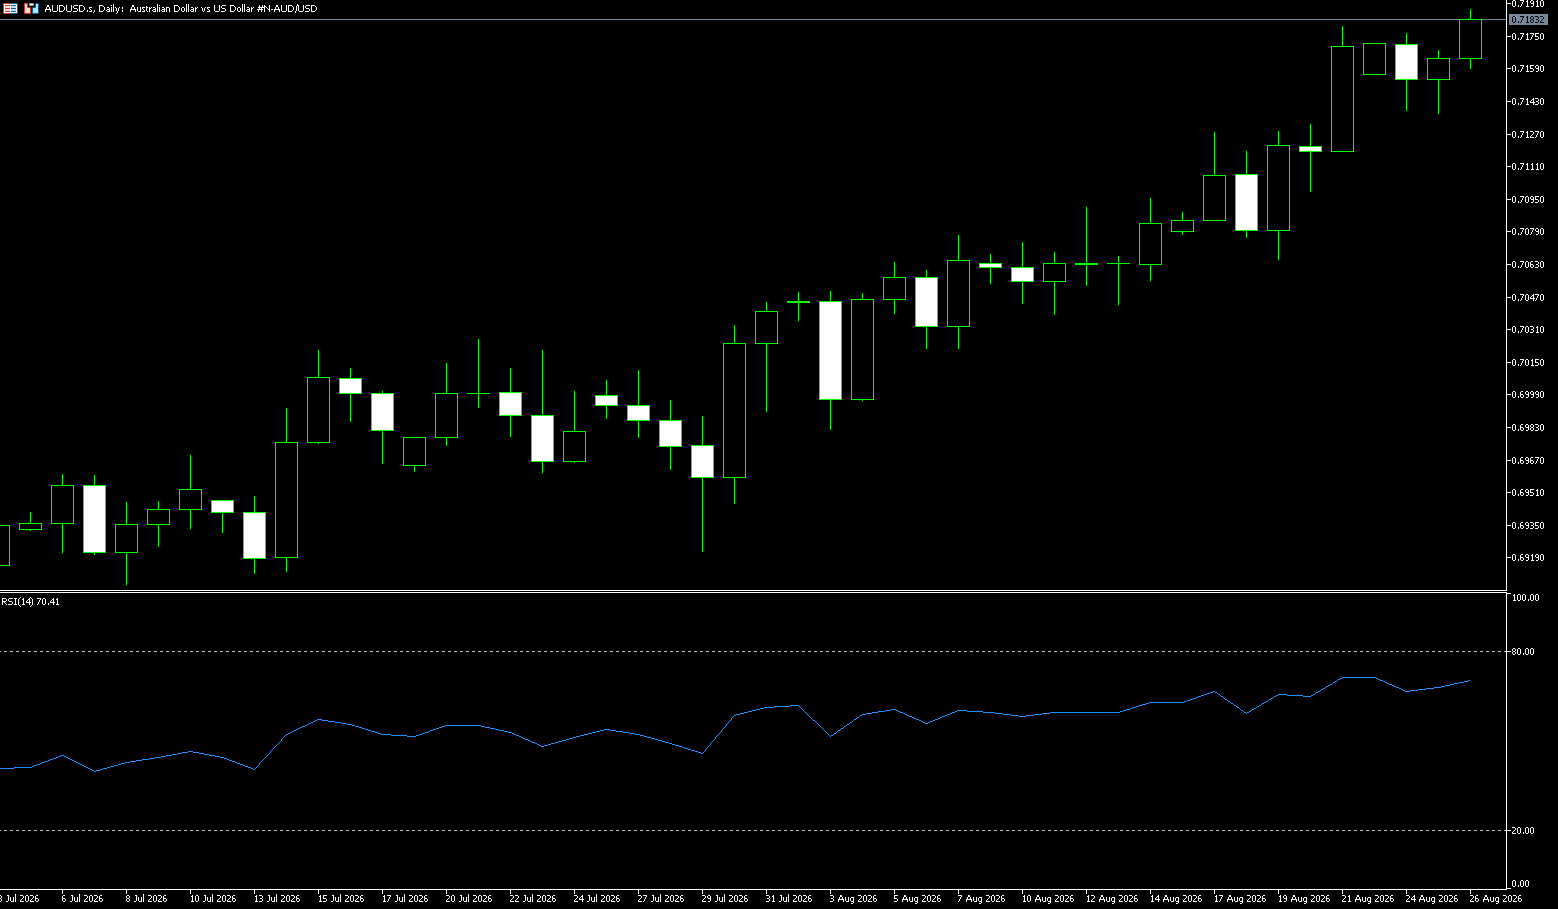
On Wednesday, the Australian dollar outperformed other major currencies, rising 0.2% against the US dollar in early European trading, approaching 0.7180. The Australian dollar strengthened after higher-than-expected Australian Consumer Price Index (CPI) data fueled market expectations of another interest rate hike by the Reserve Bank of Australia (RBA) this year. Earlier in the day, the Australian Bureau of Statistics reported that price pressures rose 1% month-on-month (MoM) in July, faster than the expected 0.8%. Inflation fell 0.1% in June. On an annualized basis, CPI rose 3.5%, higher than the expected 3.2% but lower than the previous reading of 3.8%. Market participants raised their probability of a fourth rate hike at the RBA's September policy meeting from 17% to 36%, while pricing in a move by February next year has risen to 94%. The minutes of the most recent monetary policy meeting, released yesterday, clearly indicated that the RBA currently intends to adopt a wait-and-see approach to consider its next move. After three rate hikes earlier this year, the bank believes it is well-positioned and wants to assess how inflation and the labor market continue to develop.
From a technical perspective, the AUD/USD is bullish, although momentum is waning. However, technical readings on the daily chart suggest that buyers remain in control despite the current consolidation phase. The currency pair is trading above all bullish moving averages, with the 20-day simple moving average at 0.7082 about to cross above the 100-day simple moving average at 0.7075, forming a "golden cross" pattern that provides a solid foundation for the exchange rate and suggests further highs to come. However, the same chart also shows that while technical indicators are in positive territory, they lack directional strength. AUD/USD needs to break above the near three-month high of 0.7180 to accelerate its upward momentum; in that case, the next relevant level to watch is 0.7200 (the psychological level). A higher upside target is the 0.7273 level (the high of May 13th). Short-term support lies at the 20-day and 100-day simple moving averages, followed by stronger support near the psychological level of 0.7000.
Consider going long on the Australian dollar at 0.7165 today, with a stop loss at 0.7155 and targets at 0.7210 and 0.7200.
GBP/USD
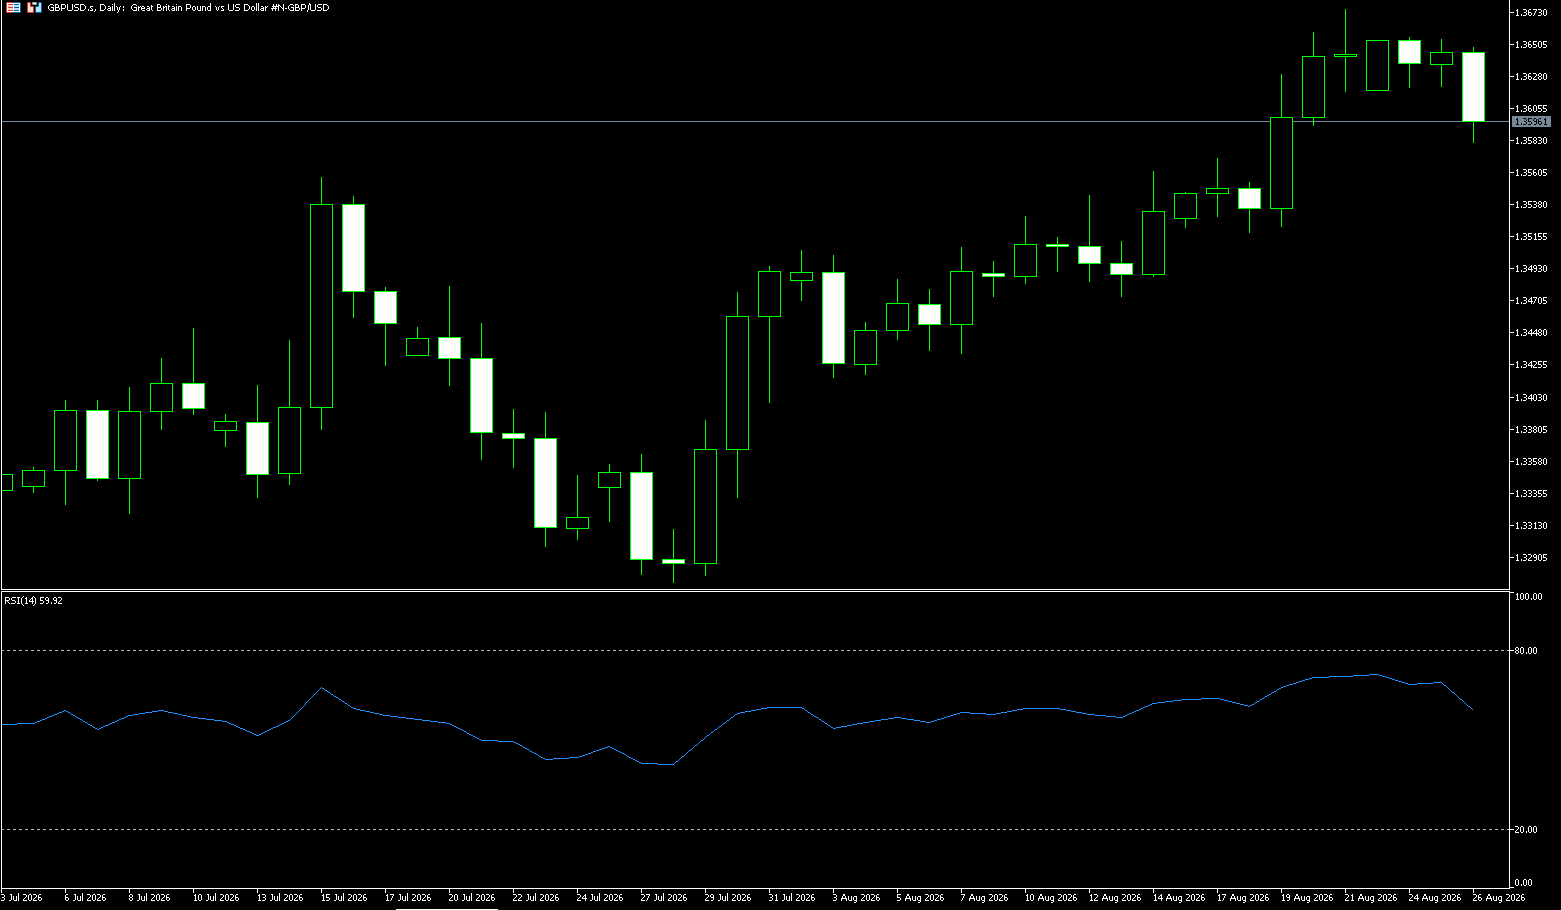
The pound/dollar pair fell to around 1.3600 during Wednesday's early European session. US Treasury Secretary Scott Bessant stated last week that the Treasury would double its bond repurchase operations to at least $4 billion per transaction, up from the current $2 billion cap, in an effort to stabilize soaring long-term borrowing costs. This move put some selling pressure on the dollar in the previous trading days. The dollar recovered some ground after CNBC reported that the department might use some of its cash balance to repurchase longer-term bonds to help stabilize long-term yields. The market will be closely watching Federal Reserve Chairman Kevin Warsh's speech at the Jackson Hole symposium on Friday. This event could provide some clues about the outlook for US interest rates. Any hawkish comments from Warsh could boost the dollar and put pressure on this major currency pair.
From a daily technical perspective, GBP/USD currently maintains a relatively positive medium-term structure, with the exchange rate below the 20-day simple moving average at 1.3532. However, in the short term, bulls need to first break through the 1.3660-1.3665 supply zone to confirm renewed upward momentum. A successful break above 1.3665 could see the exchange rate further test the 1.3700 (psychological level) and the vicinity of 1.3750; if the breakout fails, the high-level consolidation pattern will likely continue. On the downside, the 1.3600 area provides short-term psychological support, while the 20-day simple moving average at 1.3532 is a more significant structural support. If the exchange rate breaks below the 20-day moving average and forms a sustained daily close confirming this, the current bullish structure will weaken significantly, potentially opening up further technical correction potential towards the 1.3500 level.
Consider going long on GBP/USD at 1.3585 today, with a stop-loss at 1.3575 and targets at 1.3635 and 1.3650.
USD/JPY
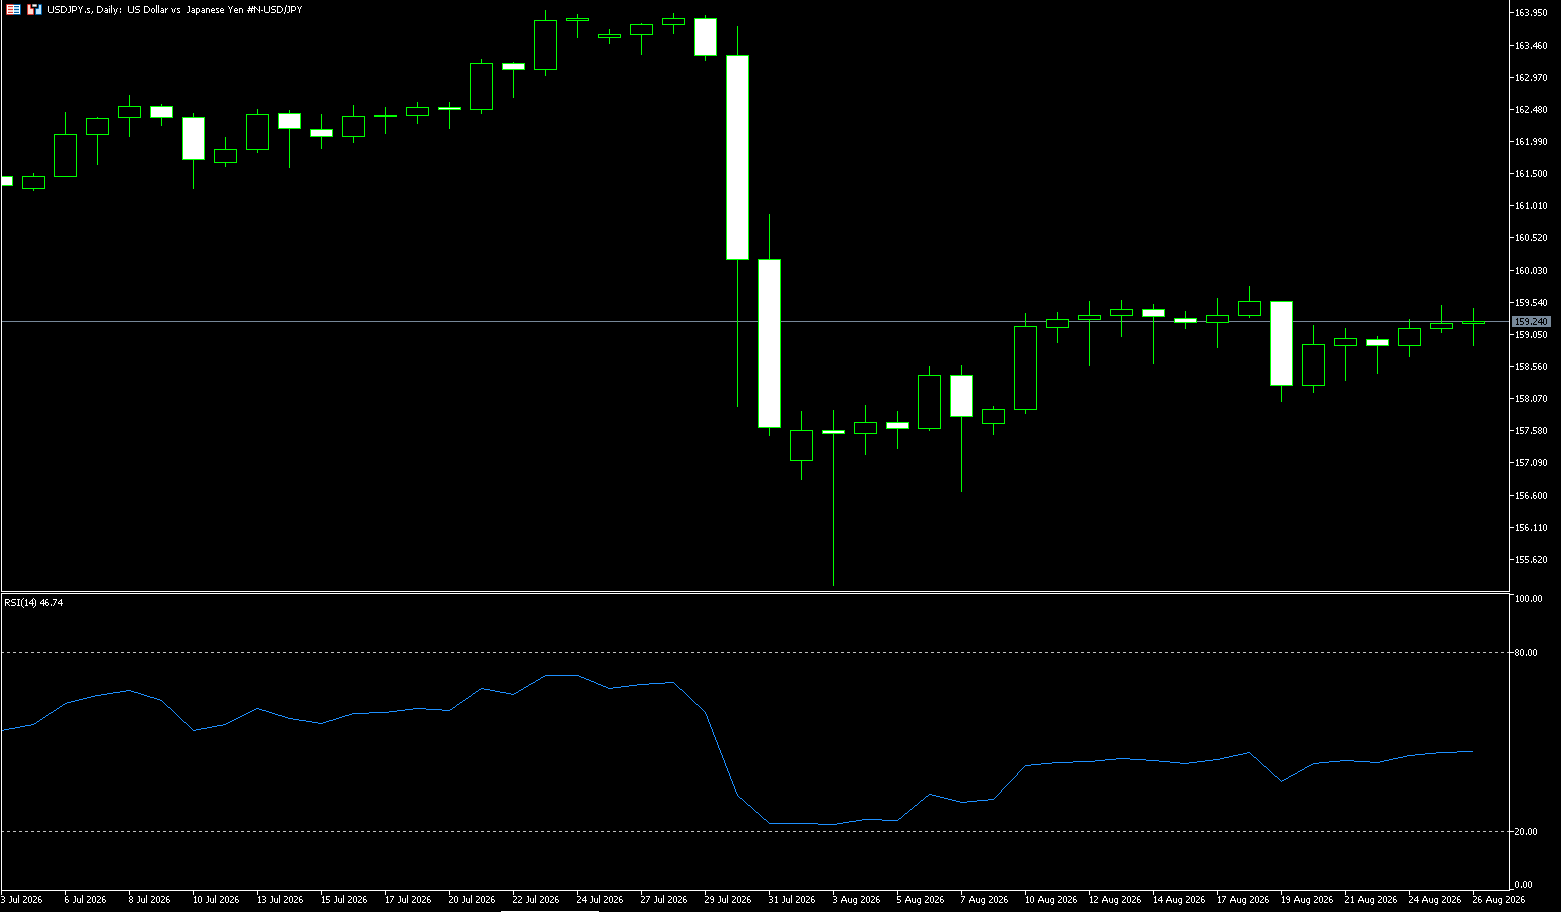
The dollar/yen pair fell to around 159.20 during Wednesday's Asian trading session. The U.S. Treasury's bond buyback program dragged the dollar lower against the yen. The market will then focus on Friday's symposium in Jackson Hole. U.S. Treasury Secretary Scott Bessant said last week that the Treasury would double the size of its bond buyback operations, with each operation at least $4 billion, up from the current $2 billion cap, in an effort to stabilize soaring long-term borrowing costs. With U.S. national debt exceeding $40 trillion, bond buybacks have raised concerns and dragged the dollar lower. The Bank of Japan said on Wednesday that Governor Kazuo Ueda will not attend the Federal Reserve's annual meeting in Jackson Hole this week due to a scheduling conflict. Bank of Japan board member Naoki Tamura will attend in his place. According to a Reuters survey conducted from August 17 to 24, 57% of economists expect the Bank of Japan to raise interest rates in September, a significant reversal from the July survey results. Of the 58 respondents, 10 believe the Bank of Japan will raise rates again to 1.50% in October or December.
On the daily chart, the USD/JPY pair is trading around 159.20, maintaining a short-term bearish bias as the spot price remains below the 100-day exponential moving average (EMA) at 159.98. The pair is trading below this short-term trendline, indicating that upward attempts are likely to be limited given weak momentum. The 14-day Relative Strength Index (RSI) is hovering around 45, suggesting weak demand but not yet oversold. On the upside, near-term resistance lies at the 100-day EMA at 159.98 and the psychological level of 160.00, which is the first hurdle for any rebound attempt and further strengthens the bearish tone if prices remain below these levels. With no clear support levels concentrated in the immediate data, the market focus remains on whether sellers can sustain pressure below the 159.00 level; a break below this level would target the 38.2% Fibonacci retracement level at 158.56 and the psychological level of 158.00.
Today, consider shorting the US dollar at 159.45, with a stop-loss at 159.60 and targets at 158.70 and 158.60.
EUR/USD
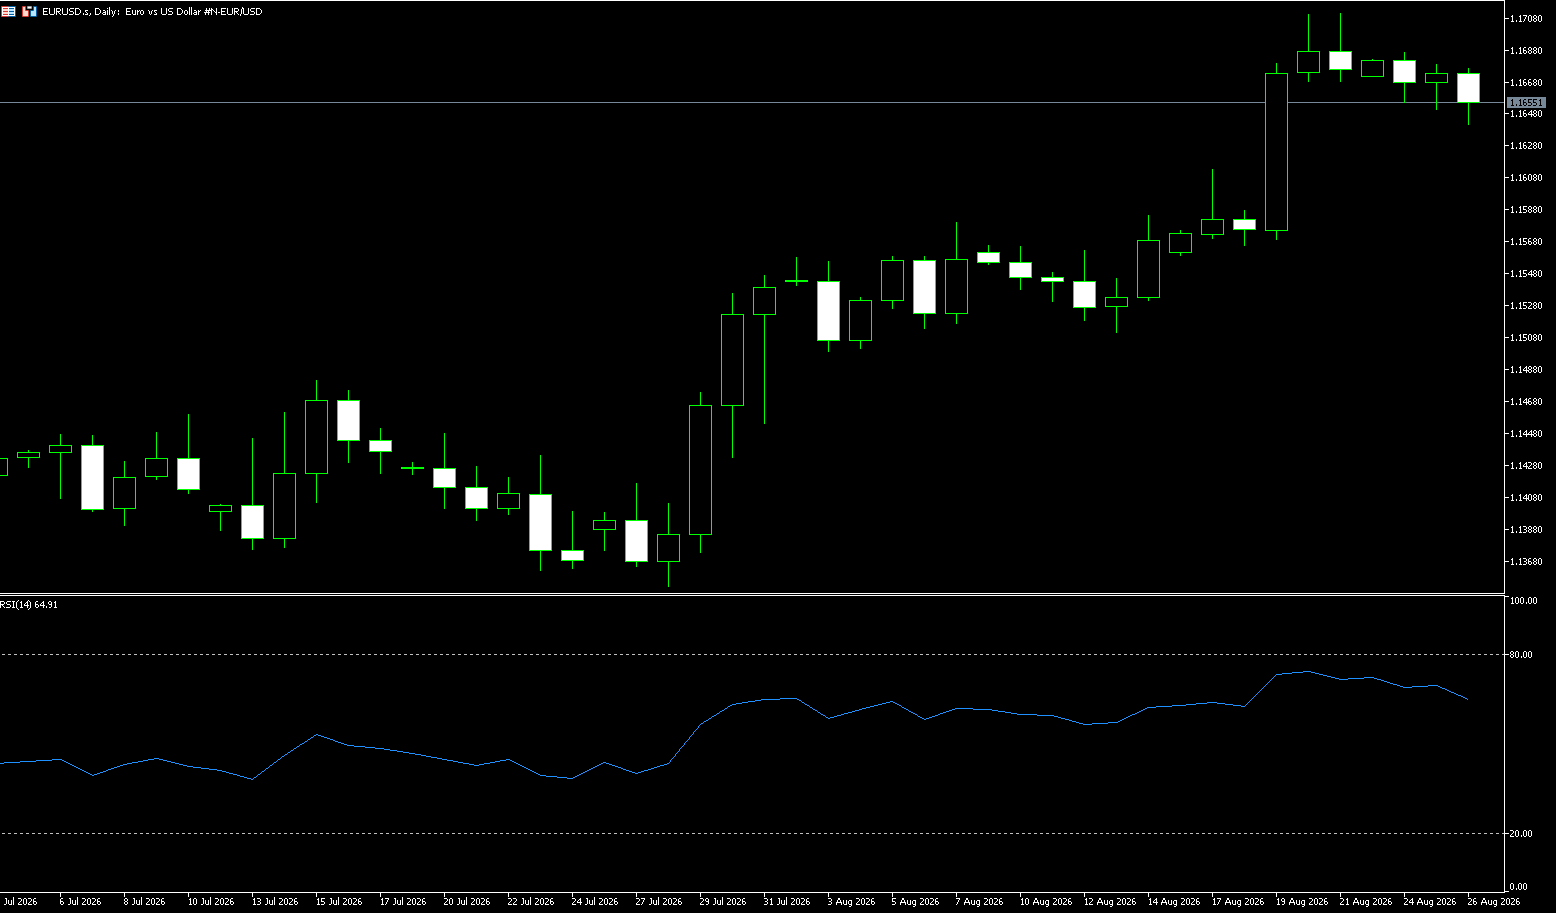
The euro held above $1.1650 in the final week of August, maintaining its highest level since mid-May, as investors braced for a more hawkish European Central Bank amid escalating geopolitical tensions in its inflation struggle. The market widely expects the ECB to raise interest rates in September, following tightening measures in June to curb inflationary pressures stemming from the US-Iran conflict and its impact on energy prices. High oil prices, the risk of further constraints on refined fuel supplies, low eurozone gas inventories, and the protracted conflict potentially extending into the November US midterm elections have all fueled expectations of further rate hikes. The currency market currently anticipates more than 40 basis points of rate hikes by the ECB this year, with the first hike potentially fully reflected next month. Meanwhile, data released on Tuesday showed that German GDP grew by 0.3% in the second quarter of 2026, higher than the preliminary estimate of 0.2%.
On the daily chart, EUR/USD is trading at 1.1660. The pair is holding above the 20-period exponential moving average (EMA) at 1.1581, and with the price close to the day's opening pivot at 1.1664, the short-term tone remains bullish. Momentum remains robust, with the 14-period Relative Strength Index (RSI) hovering around 69, suggesting strong buying pressure, but the market is also approaching overbought territory. On the downside, immediate support is currently at the psychological level of 1.1600, while the 20-period EMA at 1.1581 forms a secondary support zone. On the upside, this major pair needs to break above the August 21 high of 1.1711 to extend the rally towards the May high near 1.1800. The RSI remains bullish near the overbought threshold of 70, highlighting the strength of the recent gains. The latest rally appears to have stalled above short-term resistance around 1.17, but lacks any additional significant resistance before 1.18, meaning the upside potential is relatively unimpeded in the short term.
Consider going long on Euros today at 1.1645, with a stop-loss at 1.1635 and targets at 1.1700 and 1.1710.
Stock Analysis:
Australian ASX 200 Stock Index
Basic Market Overview:
The Australian Securities Exchange (ASX) 200 index fell 37 points, or 0.4%, to close at 9,128 on Wednesday, reversing earlier gains and marking its first decline in three days. Market sentiment weakened as most US futures fell, with investors focused on the Personal Consumption Expenditures (PCE) inflation report later today and Federal Reserve Chairman Warsh's speech in Jackson Hole on Friday. Locally, Australia's overall inflation in July exceeded expectations due to rising fuel and travel costs, while core inflation also unexpectedly rose, increasing the risk of another interest rate hike. Meanwhile, construction work fell 2.1% quarter-on-quarter in the second quarter, contrary to expected growth. Technology, communications, and energy mining drove the losses, although strong performance in non-energy mining and retail trade limited the declines.
Lynas Rare Earth plunged 3.9% after missing earnings expectations, while two of the Big Four banks saw their share prices fall between 0.1% and 1.1%. In contrast, Evolution Mining rose 0.4% due to higher gold prices. Woolworths shares surged 3.7% after reporting strong earnings and indicating consumers would seek deals amid tight household budgets.
Sector Performance:
Leading Gains: Information Technology +2.25%, Consumer Staples +2.11%, Healthcare +1.40%, Financials sector strengthened.
Lagging Gains: Energy sector -0.78%, REITs closed slightly lower -0.11%; Materials sector was mixed, with major mining companies BHP and Rio rising, while lithium mining stocks retreated.
Key Highlights: BHP hit a new high; Healthcare stocks Ansell and CSL rose sharply; some lithium mining stocks saw profit-taking.
Technical Analysis:
The ASX 200 index closed at 9128 points on Wednesday, down 0.40%, with a high of 9220.6 and a low of 9128, giving back earlier gains and ending a three-day winning streak. Candlestick Pattern: A bearish candlestick pattern indicating a pullback after a surge, with a significant upper shadow, suggesting selling pressure has eased. The price has been declining from its historical high of 9296.7, entering a short-term consolidation and correction phase. Australian July inflation exceeded expectations, increasing the risk of another RBA rate hike; coupled with market anticipation of US PCE inflation and the Jackson Hole speech, risk appetite has contracted. Technical Indicators: The daily RSI has retreated from its high, and the MACD histogram is contracting, indicating weakening bullish momentum. However, the medium-term moving averages are still trending upwards, suggesting a pullback after an uptrend, not yet a bear market.
Thursday Technical Analysis: With the Jackson Hole event approaching, uncertainty is high. Without a clear signal, it's advisable to reduce positions and wait for a breakout in the 9000 or 9220 direction before entering. Sector-wise, a preference is given to gold mining and consumer staples; avoid high-priced technology and overvalued growth stocks. Scenario Prediction: Strong Scenario: Holding above 9080, a rebound to test 9180-9220 is possible; only a strong break above 9220 with significant volume will offer a chance to challenge new historical highs. Weak Scenario: A decisive break below 9080 will likely lead to a further decline towards the 9000 level; if 9000 is breached, the pullback target is around 8900. Neutral Scenario: High probability of range-bound trading, awaiting guidance from overseas macroeconomic signals, with increased volatility.
Trading Strategy:
Short-Term Trading Strategy (Intraday - 3-Trading-Day Perspective)
1. Bullish Strategy
• If the price retraces and stabilizes within the 9080-9100 range, a small long position can be considered; the stop-loss should be set below 9040; the first target is 9180, and the second target is 9220.
• 9000 is the defensive line; chasing the price higher at this level is not recommended.
2. Short-selling Strategy
• A rebound to 9180-9220 followed by a pullback presents a small short-selling opportunity; stop-loss above 9245; initial target 9100, with a further target of 9020 if it breaks down.
Key Risk Warnings:
1. Australian inflation data continues to exceed expectations, and the RBA's signal of an interest rate hike will directly pressure the stock index, with the 9000 level at risk of being breached.
2. US PCE inflation and a more hawkish-than-expected Jackson Hole speech will lead to a global risk asset correction, potentially dragging down the ASX200.
3. Significant price fluctuations in commodities (iron ore, gold) will amplify index volatility due to fluctuations in resource-heavy stocks.
4. The market is currently in a high-level correction phase, with increased risk of both upward and downward volatility. Strict stop-loss orders are essential; avoid heavy positions in a single direction.
Hong Kong Hang Seng Index
Basic Market Overview:
The Hang Seng Index rose 0.6%, or 142 points, to close at 25,653 on Wednesday, after an overnight rebound in Wall Street tech stocks, a decline in oil prices, and a drop in US Treasury yields provided some support for Asian markets, although uncertainty surrounding the US-Iran situation kept investors cautious. The gains were led by healthcare stocks, with Innovent Biologics rising 9.7%, while the rise in tech stocks also supported overall market sentiment. Alibaba also attracted attention after Chairman Joseph Tsai increased his holdings by 720,000 shares, worth approximately HK$82 million, following previous increases by other executives.
This increase helped alleviate market concerns about the company's HK$8 billion share placement for its artificial intelligence expansion, expected to be completed on Wednesday. Stocks to watch include Tencent (0.8%), SMIC (2.7%), Xiaomi (2.5%), Meituan (1.1%), and MiniMax (1.1%).
Sector Performance:
Leading Declining Sectors: Information & Communication, Semiconductor Equipment, Insurance; SoftBank Group, Advantest Test, and Kioxia Holdings saw the largest declines.
Leading Gaining Sectors: Services, Construction, Other Products; Defensive and cyclical sectors at lower levels showed relative resilience.
Technical Analysis:
The Hang Seng Index closed at 25652.97 on Wednesday, up 0.56%, with an intraday range of 25615-25800 points and a total turnover of HK$254.824 billion. The Hang Seng Index shows a weak red bar, indicating weak rebound momentum; the KDJ indicator is turning upwards from a low level, suggesting short-term recovery potential, but significant upward pressure makes a pullback likely after a rally. Summary of Wednesday's performance: Overnight, overseas markets fluctuated, and the Hang Seng Index recovered weakly from support levels. Cyclical sectors drove the index upwards, but the rebound volume was insufficient, and there was significant upward pressure. It remains within a trading range and has not yet broken through key resistance levels; the medium-term trend remains weak.
Thursday's Technical Analysis: On the daily chart, continue to observe whether the MACD can form a golden cross; on the 60-minute chart, focus on whether the red bars expand. If the red bars continue to shrink, the rebound is likely to fail, and a return to a downward trend is possible. Currently, the ADX value is low, indicating weak trend strength, and the risk of false breakouts and whipsaws is high. Key price levels: Short-term support: 25420-25450; strong support: 25380; a decisive break below this level would indicate a return to a weak trend. Short-term resistance: 25680-25720; strong resistance: 25780-25800; a break above 25800 would open up further upside potential. Two technical scenarios are proposed: Stronger scenario: Holding the 25420 support level, pushing upwards towards the 25680-25720 resistance level; a break above 25800 with increased volume indicates a continuation of the rebound, targeting around 26000. Prerequisites: Stable overnight sentiment in US stocks, with continued capital inflows into Chinese stocks. Weak Scenario: After opening, the market will face pressure, breaking below 25420 with increased volume, further testing strong support at 25380. If 25380 is breached, the index will weaken again, testing the lower edge of the range around 25200.
Trading Strategy:
Operation Strategy (Short-Term Perspective)
1. Bullish Strategy
• If the price retraces to the 25420-25450 range and stabilizes, a small long position can be attempted; the stop-loss should be placed below 25370.
• First take-profit target: 25680-25720; if the price breaks above 25800 with increased volume, the stop-loss can be moved up, targeting around 26000.
2. Bearish Strategy
• If the price rebounds to the 25680-25720 resistance zone but fails to break through and falls back, a short position can be attempted; the stop-loss should be placed above 25830.
• First profit target: 25450-25420; a break below 25380 could lead to a further target around 25200.
Key Risk Warnings:
1. The Hang Seng Index is heavily influenced by US stocks, US Treasury yields, and expectations of Federal Reserve policy. External volatility can directly cause gaps at the open of Hong Kong stocks, easily triggering stop-loss orders.
2. Currently in a range-bound trading pattern, trend signals are unclear, and the probability of false breakouts is high. Avoid chasing highs and lows; strict stop-loss orders must be set, and do not hold losing positions.
3. Sector rotation is rapid; today's leading sectors are likely to change the next day. Do not simply follow the long-term prospects of a single day's strong sector.
4. Domestic policy news, real estate, and internet regulatory news can bring sudden spikes and drops in price.
Disclaimer: The information contained herein (1) is proprietary to BCR and/or its content providers; (2) may not be copied or distributed; (3) is not warranted to be accurate, complete or timely; and, (4) does not constitute advice or a recommendation by BCR or its content providers in respect of the investment in financial instruments. Neither BCR or its content providers are responsible for any damages or losses arising from any use of this information. Past performance is no guarantee of future results.
Lebih Liputan






2026 © - All Rights Reserved by BCR Co Pty Ltd
Pendedahan Risiko:Instrumen derivatif diniagakan di luar bursa dengan margin, yang bermakna ia membawa tahap risiko yang tinggi dan terdapat kemungkinan anda boleh kehilangan seluruh pelaburan anda. Produk-produk ini tidak sesuai untuk semua pelabur. Pastikan anda memahami sepenuhnya risiko dan pertimbangkan dengan teliti keadaan kewangan dan pengalaman dagangan anda sebelum berdagang. Cari nasihat kewangan bebas jika perlu sebelum membuka akaun dengan BCR.
BCR Co Pty Ltd (No. Syarikat 1975046) ialah syarikat yang diperbadankan di bawah undang-undang British Virgin Islands, dengan pejabat berdaftar di Trident Chambers, Wickham’s Cay 1, Road Town, Tortola, British Virgin Islands, dan dilesenkan serta dikawal selia oleh Suruhanjaya Perkhidmatan Kewangan British Virgin Islands di bawah Lesen No. SIBA/L/19/1122.
Open Bridge Limited (No. Syarikat 16701394) ialah syarikat yang diperbadankan di bawah Akta Syarikat 2006 dan berdaftar di England dan Wales, dengan alamat berdaftar di Kemp House, 160 City Road, London, England, EC1V 2NX. Open Bridge Limited bertindak semata-mata sebagai pemproses pembayaran untuk BCR Co Pty Ltd dan tidak menyediakan sebarang perkhidmatan kewangan, perdagangan atau pelaburan bagi pihaknya. Peranan Open Bridge Limited adalah terhad kepada pemprosesan pembayaran.


 English
 简体中文
简体中文
 繁體中文
繁體中文
 Bahasa
Melayu
Bahasa
Melayu
 Tiếng
Việt
Tiếng
Việt
 ไทย
ไทย
 日本語
日本語
 한국어
한국어
 ភាសាខ្មែរ
 español